This plugin generates trend reports for the Testability Explorer, an open source program which uses byte-code analysis to look for testability pitfalls in Java code.
Description
Testability Explorer is an open-source tool that identifies hard-to-test Java code. Testability Explorer provides a repeatable objective metric of "testability." This metric becomes a key component of engineering a social change within an organization of developers. The Testability Explorer report provides actionable information to developers which can be used as measure of progress towards a goal and a guide to refactoring towards a more testable code-base. Further information can be found here.
The Plugin
The following features are provided by this plug-in:
- Configuration
- Configuration of the XML report files to scan after a build.
- Configurable threshold value at which a build will become unstable if your code's testability is beyond this number.
- Trend reports
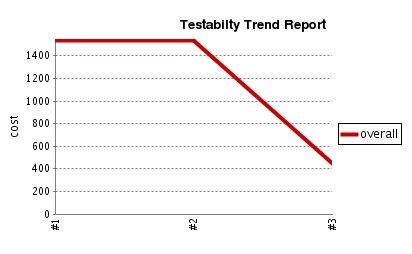
- Overall testability cost for your project.
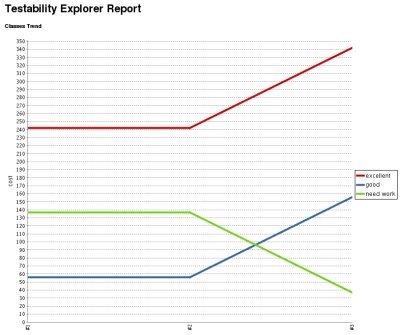
- Number of excellent, good and poor testable classes in your project.
- Detailed information how the testability cost is aggregated per class.
The current release is available in the download section. This plug-in is developed and maintained by Reik Schatz. Please use the Hudson mailing lists or the Testability Explorer mailing list to ask questions, create feature request or bug reports.
Installation
Use the Hudson plugin browser or
Download
and install the plugin. Restart Hudson, then go to your project and
click on Configure in the left menu.
Configuration
Check Publish Testability Explorer Report. Enter the correct path to
your Testability Explorer report files. The path will be relative to
your project root. The project root is usually where your build.xml
(Ant) or pom.xml (Maven) file is located. Let's say as part of your
build, you create the Testability Explorer report in
reports/testability/result.xml, then the Report File Pattern for
Hudson would have to be reports/testability/result.xml or
reports/testability/*.xml if you want to use a Wildcard.
The Overall Threshold is a number value representing an overall testability cost. By setting this threshold you define that your project code base, must not have a higher overall testability cost than this number. If the testability cost is higher, the build will become unstable. As a rule of thumb, a good testability is below 100 but aim for a score below 50. The Hudson core project has more than 500 classes and a great testability score of just 22!
The Per-Class Threshold is a number value representing a testability cost on a per class basis. By setting this threshold you define that not a single class in your project may have a higher testability cost than this value. If the testability cost of any class is higher, the build will become unstable.

Reports
For each individual build you can review the testability scores. Click on a single build in the left column then on the Testability Explorer Report icon in the screen center. This will bring up the detailed report. You can see a summary on a class basis, which will show you the number of classes in your project and how many of them a excellent, good and poor testable. The total is the overall testability score for your project.
In the lower section of the start screen, you will see the 20 least testable classes in your project.

You can click on any of these classes to see an aggregation of what is causing the cost on a method level. For every method in the selected class, you can see how much testability cost is associated. The methods will be ordered by their cost - highest first. Depending on the testability cost, the rows will be marked red, yellow or green. The colors map to what Testability Explorer considers excellent, good and poor.


Then for each method, you can go into further detail and see how the cost is computed. Within the method, as your code executes, every line might come with a testability cost. This screen will tell you what is causing the cost.is found within a

Trends
In the main project page, you have a testability trend graph to the right side. This is how your overall testability is evolving during the different builds. The Testability Explorer Report icon in the center and the left menu, will bring you to a testability trend graph on the class level. You can see how many excellent, good or poor testable classes you have and how this number is changing over time.


Changelog
Version 0.4 (May 29, 2012)
- Restored functionality
Version 0.3 (Dec 29, 2009)
- Added support for report aggregation
- Report improvements
- Better html output
- Tabbing with context header
- Conditional rendering depending on the amount of results available
- I18N modifications + Dutch translations
- Updated uses of deprecated APIs
Version 0.2 (Jan 14, 2009)
- fixed bug where number of classes in report summary will always be between 1 and 20
- added colors to rows in report summary
- added new configuration value "per-class threshold"
- method signatures in report screens are not abbreviated after 130 characters
- fixed a bug where no report classes showed up in report summary if you had only 1 class in your project
- methods in report screens are ordered by their testability cost
- added method details and cost reason as report screens
- fixed a bug where trendline in graphs was interrupted in builds
Version 0.1
- First version