Allows users to execute a Silk Performer load test: Silk Performer
The Silk Performer plugin for Jenkins has received a major upgrade and now provides a number of new features. It lets you automate Silk Performer projects, collect results, and evaluate success conditions. This article guides you through setting up the plugin. To learn more about the new features and enhancements of the plugin, read the blog post Released: Silk Performer 19.5.
Setting up the plugin involves the following steps:
-
Installing the plugin
-
Adding a Jenkins agent
-
Creating a job
-
Adding build steps
-
Adding post-build actions
-
Executing the job
1. Installing the plugin
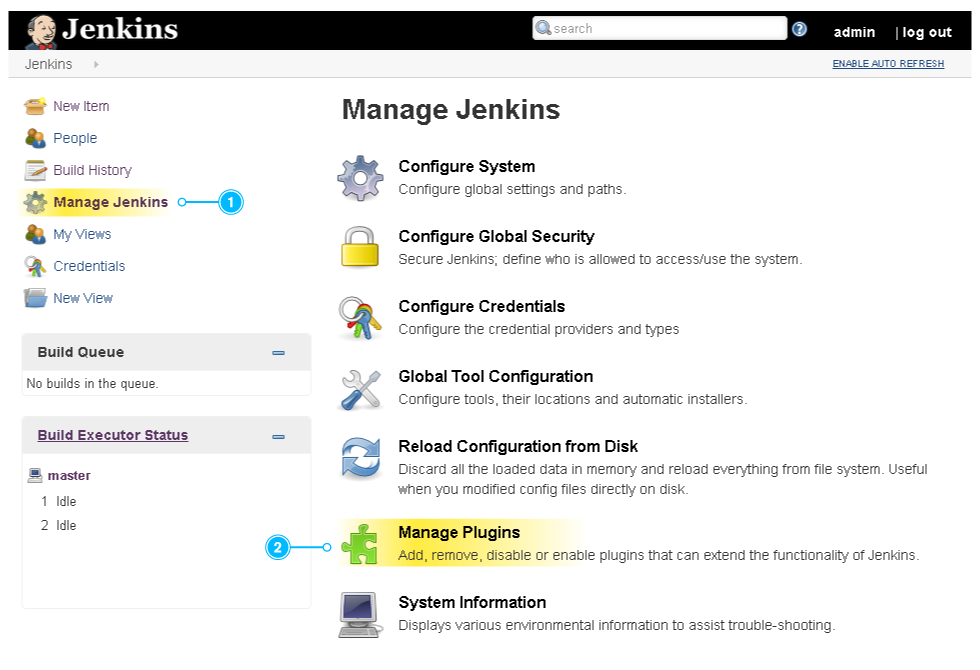
First, open Jenkins in a browser. Click Manage Jenkins in the menu on the top left ① and click Manage Plugins ②.
 {width="700"}
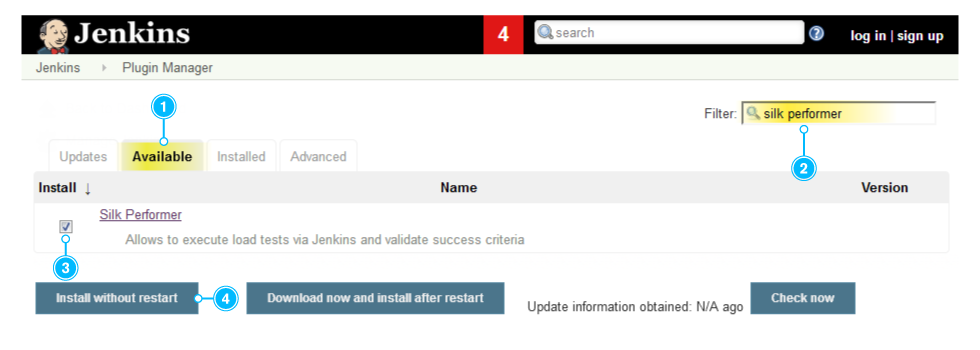
Click the Available tab ① and enter Silk Performer in the filter on the top right ②. Now we can click the check box ③ and Install without restart ④.
 {width="700"}
2. Adding an agent
The Silk Performer plugin is installed. To run a Silk Performer project in Jenkins you need a Jenkins agent node running on Windows in a 32-bit JRE. In addition, Silk Performer must be installed on the agent node. If you don't have such an agent yet, create a new one:
- Click Manage Jenkins, Manage Nodes, and New Node.
- Enter a name, select Permanent Agent, and click OK.
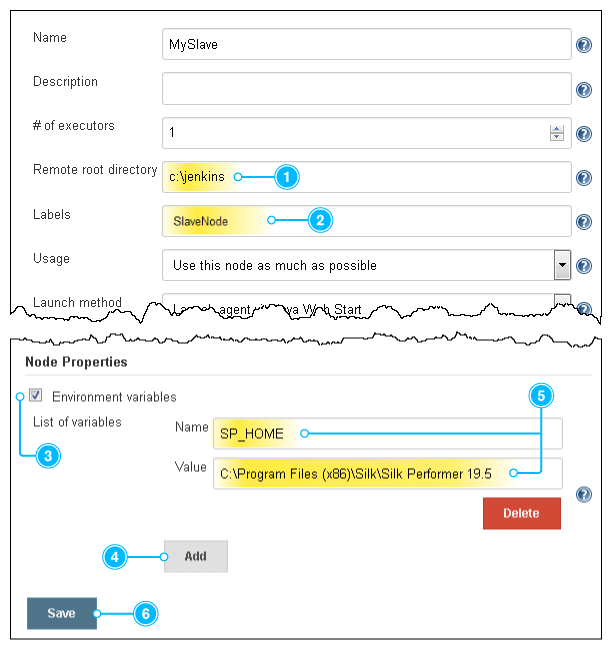
- Configure the agent as follows: Specify a Remote root directory
① and a label ②.
In our example, we add the label SlaveNode. - Check Environment variables ③ and click Add ④. Name the
variable SP_HOME and
specify the installation directory of Silk Performer as value ⑤. In most cases, the installation directory will resemble the following:
C:\Program Files (x86)\Silk\Silk Performer 19.5 - Click Save ⑥.
3. Creating a job
Once the agent is online, you can create a new job using this agent.
- Click New Item, enter a name, click Freestyle Project, and click OK.
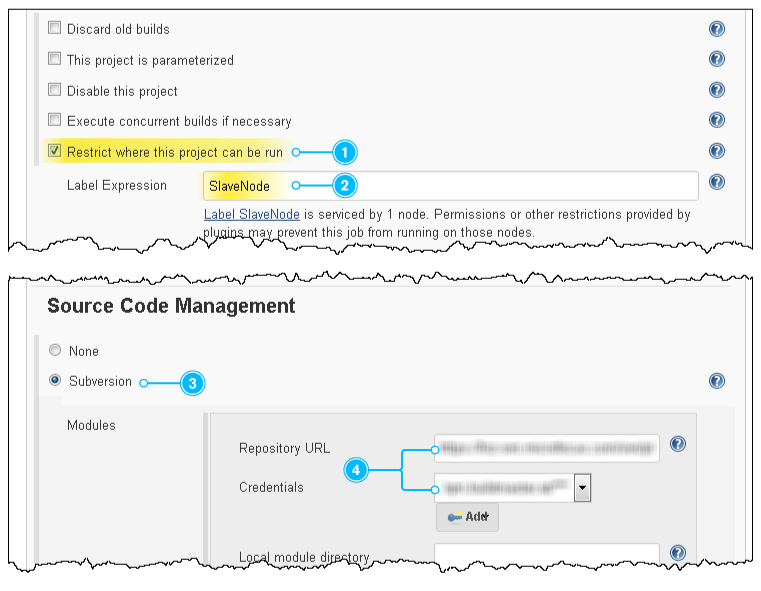
- Restrict the project to the agent you have just created: Check
Restrict where this project can be run ① and specify the
Label Expression ②.
In our example, this is the label SlaveNode, as defined above. - Configure your Source Code Management system that holds your Silk Performer projects. In our example, we use Subversion ③ including the respective URL and credentials ④.
 {width="700"}
4. Adding build steps
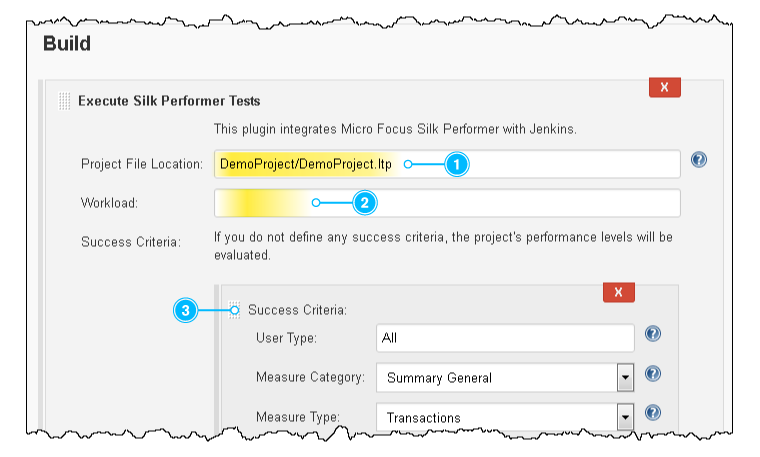
- In the Build section, click Add build step and Execute Silk Performer tests.
- Specify the Project File Location ①. This is a relative path to your workspace.
- Specify a Workload ②. If you omit this field, the project’s default workload will be used.
- You can add custom Success Criteria ③ directly in the build step or rely on the performance levels defined within the Silk Performer project.
 {width="700"}
5. Adding post-build actions
-
Click Add post-build action and Archive the artifacts. Then specify the Files to archive.
In our example, we defined DemoProject/**/*.
Make sure to use the wildcards as shown here to get hold of all files in all folders, including all subfolders. -
To get a trend chart, click Add post-build action and Plot build data.
-
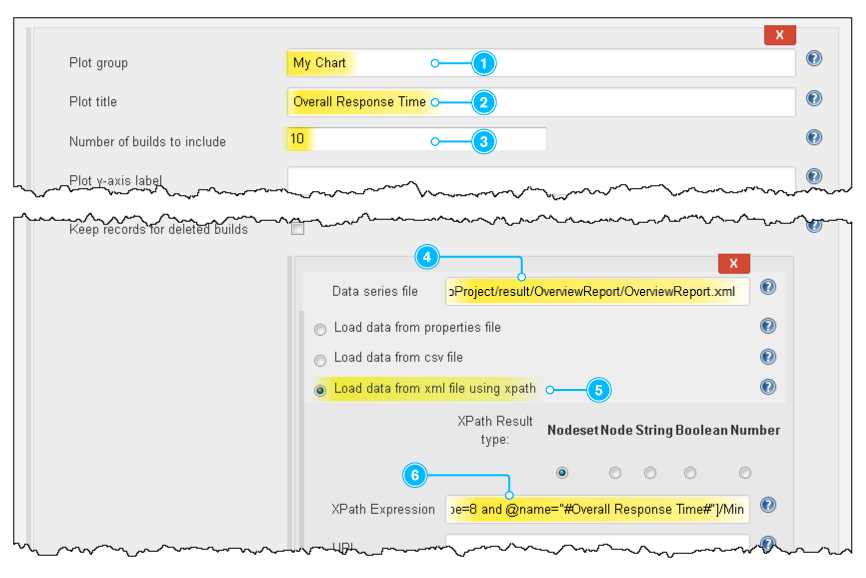
Specify a Plot group ①, a Plot title ②, and the Number of builds to include ③.
-
Specify a Data series file ④. In our example, we use the OverviewReport.xml, which is collected by the action Archive the artifacts.
-
Select Load data from xml file using xpath ⑤ and specify an XPath Expression ⑥ to read any value of the .xml file. In our example, we use the following expression:
Overview_Report_Data/UserGroups/Group[Name="DemoProject_testsite.bdf/VUser-Profile1"]/Measures/``Measure[Class="Transaction" and Name="#Overall Response Time#" and Type ="Trans.(busy) ok[s]"]/``Avg
 {width="700"}
- To include additional values in the chart, for example the maximum,
click Add.
In our example, we define the maximum value using the following expression:
Overview_Report_Data/UserGroups/Group[Name="DemoProject_testsite.bdf/VUser-Profile1"]/Measures/``Measure[Class="Transaction" and Name="#Overall Response Time#" and Type ="Trans.(busy) ok[s]"]/``MaxMax
-
Click Save. The job is now configured.
6. Executing the job
Everything is set up now. Execute the job on the agent to receive load test results.
- Tip: The console provides valuable information while the job is being executed.
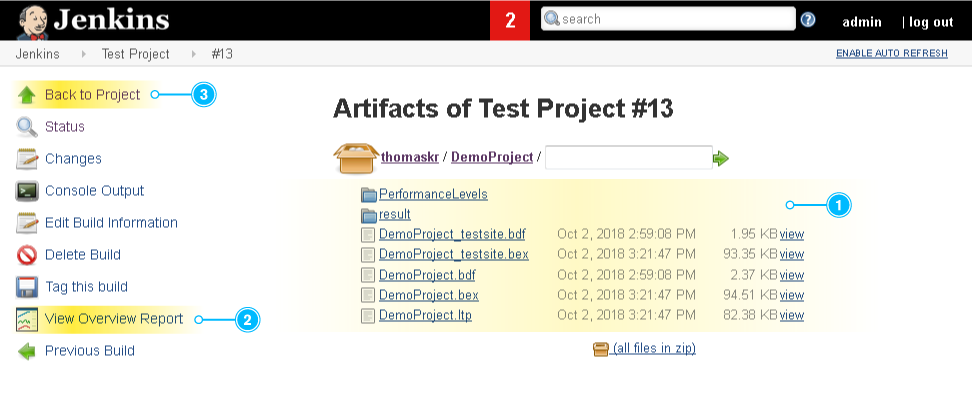
- Once the job is completed, click Last Successful Artifacts to view the artifacts of the load test ①.
- Click View Overview Report ② to open the report directly within Jenkins.
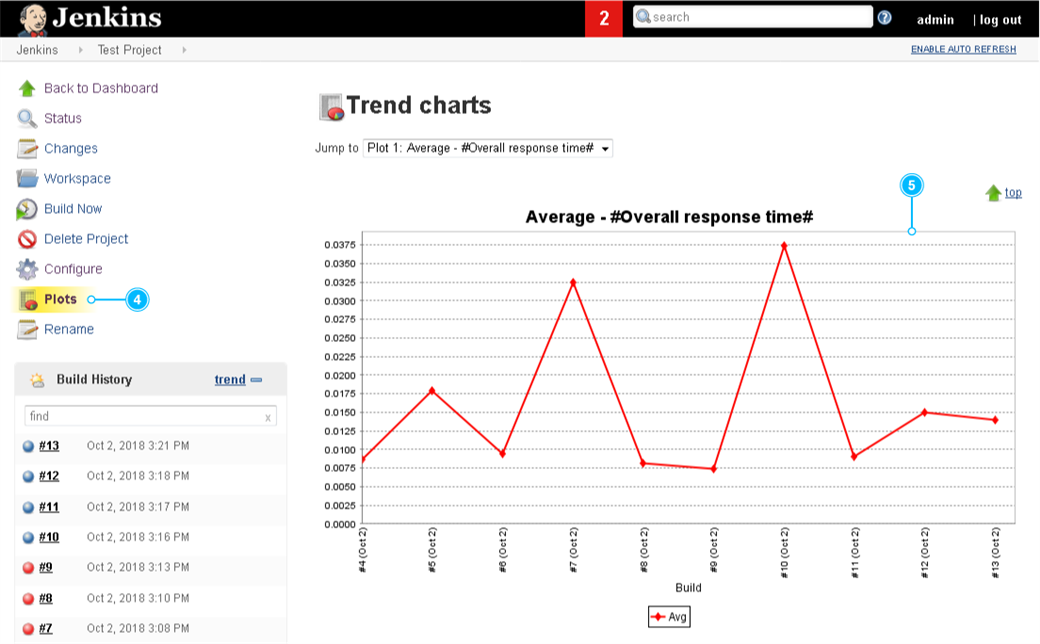
- Click Back to Project ③ and Plots ④ to view the chart ⑤ you have configured above.
 {width="700"}
 {width="700"}
Note: If you do not use English as your Jenkins locale, the chart might not display any data. To fix this problem, install the Locale plugin. Then click Manage Jenkins > Configure System, and set the Default Language to English.
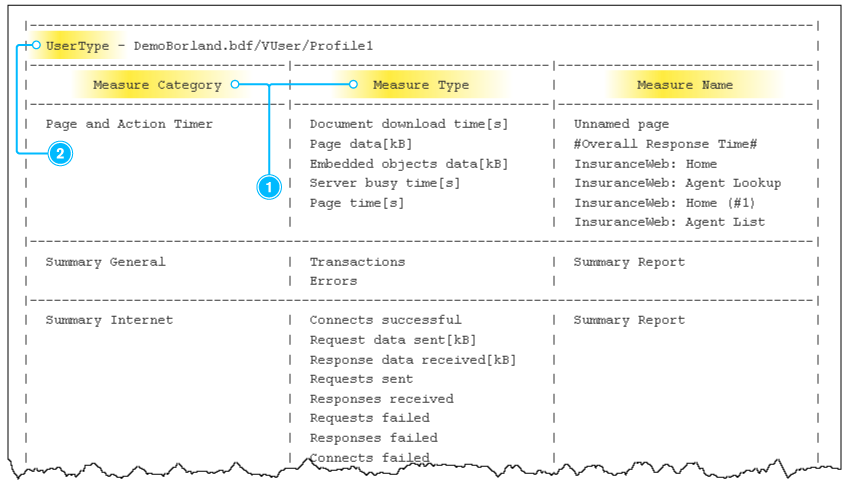
After the first execution it can be helpful to take a look at the console output. It shows a table with the columns Measure Category, Measure Type, and Measure Name ① for each user type ②. You can use these tables to define success criteria for upcoming executions. Review the screenshot in step 4: it shows the very same parameters (user type, measure category, etc.).
 {width="700"}