Jenkins plugin to monitor pull requests with a customizable dashboard.
Explore the docs »
Report Bug · Request Feature
At the Jenkins UX SIG Meeting on 28. April 2021, there was a live demo of the first beta version (1.0.3-beta).
Many software teams have changed their development processes to lightweight pull requests. Changes to the software are packed into such a pull request, which is then manually reviewed and also automatically built in the CI/CD server. In Jenkins, however, these pull requests are not "first-class citizens"; the results of a pull request are currently simulated via branches.
For developers, this representation is insufficient: instead of having Git diffs, tests, static analysis, etc. as an overview in the overall project, a filtered representation of these results on the changes actually made would be much more helpful.
This plugin offers a possibility to display and aggregate the results (in the form of individual views) of a pull request in a configurable dashboard. Views can only be accessed or displayed if the corresponding plugin fulfils certain requirements and already provides a view.
- Muuri wrapped in Jenkins Muuri.js API Plugin
- Select2 wrapped in Jenkins Select2.js API Plugin
Currently, only multibranch pipelines projects are supported to use this plugin. Therefore, you have to install the corresponding Jenkins plugin Multibranch: Pipeline and connect to own of your SCM Repositories to use the Pull Request Monitoring Jenkins plugin.
This plugin relies on other plugins to provide a view that aggregates and provides delta metrics for a pull request.
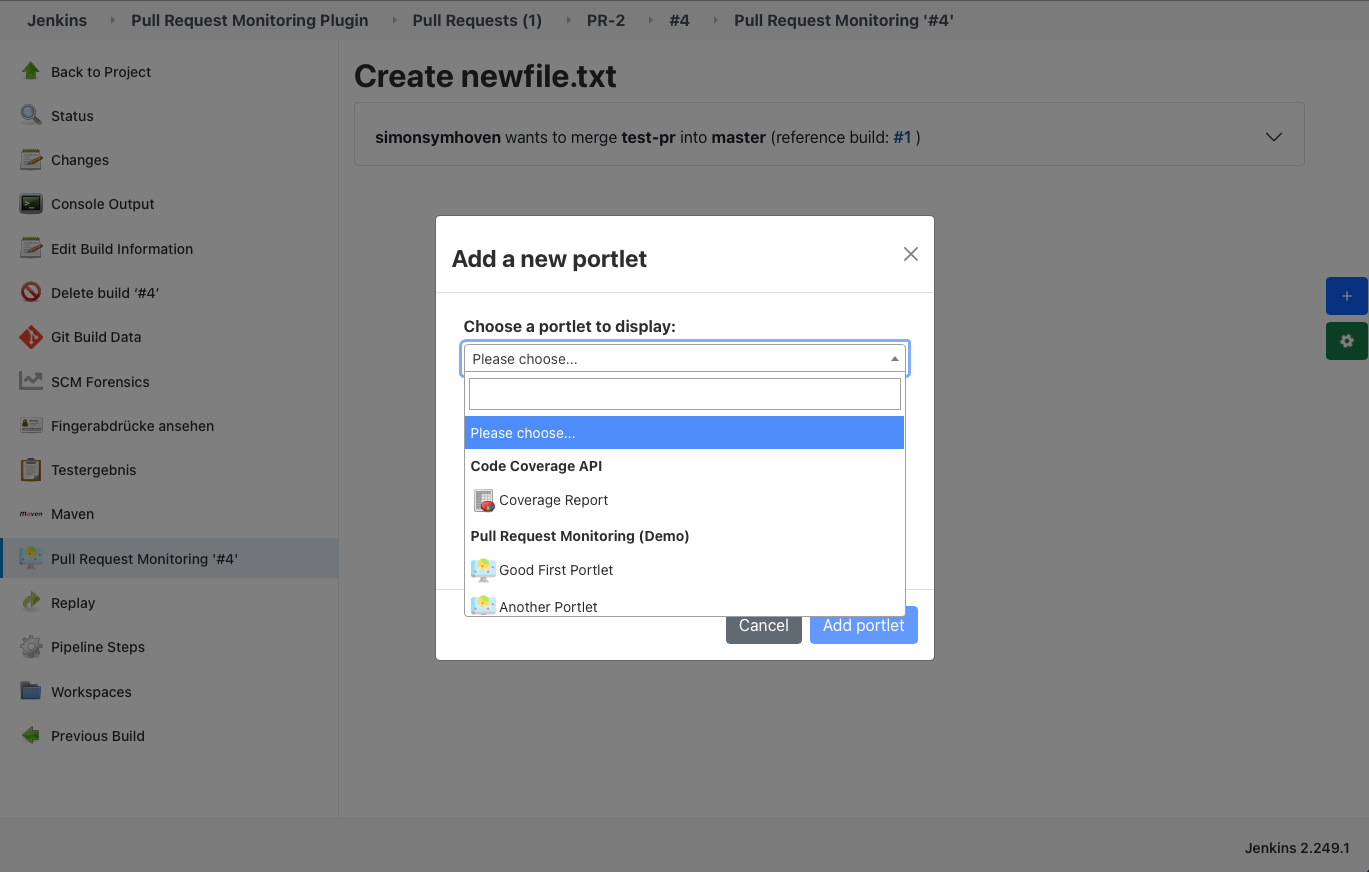
The MonitorPortlet class defines the base class for each portlet that is to be displayed. In order to register the portlet for the plugin, a factory class is required, which must be provided with the annotation @Extension. The factory has to extend the MonitorPortletFactory abstract class, receives the current Run<?,?>, delivers a set of MonitorPortlets and defines a displayedName, which appears as optgroup in the dashboard in the dropdown list of all available portlets and their corresponding factory.
Normally, one plugin delivers one portlet. A minimal example could look as follows:
/**
 *  An example Monitor Portlet implementation with one portlet delivered by factory.
 */
public class DemoPortlet extends MonitorPortlet {
    private final Run<?, ?> build;

    /**
     * Create a new {@link DemoPortlet}.
     *
     * @param run
     *          the {@link Run}
     */
    public DemoPortlet(Run<?, ?> run) {
        this.build = run;
    }

    /**
     * Defines the title of portlet. It will be shown in the
     * upper left corner of the portlet.
     *
     * @return
     *          the title as string.
     */
    @Override
    public String getTitle() {
        return "Demo Portlet";
    }

    /**
     * Defines the id for the portlet.
     *
     * @return
     *          the id.
     */
    @Override
    public String getId() {
        return "demo-portlet-id";
    }

    /**
     * Defines whether the portlet is shown per default in the user dashboard or not.
     *
     * @return
     *          true if portlet should be shown, false else.
     */
    @Override
    public boolean isDefault() {
        return true;
    }

    /**
     * Defines the preferred width of the portlet. It's
     * possible to override the default width by user.
     *
     * @return
     *          the width as int. (range from 100 to 1000)
     */
    @Override
    public int getPreferredWidth() {
        return 300;
    }

    /**
     * Defines the preferred height of the portlet. It's
     * possible to override the default height by user.
     *
     * @return
     *          the height as int. (range from 100 to 1000)
     */
    @Override
    public int getPreferredHeight() {
        return 200;
    }

    /**
     * Defines the icon, which will be shown in the dropdown of
     * all available portlets in the dashboard.
     *
     * @return
     *          the icon url as {@link java.util.Optional} of string, or an
     *          empty Optional, if a default icon should be added.
     */
    @Override
    public Optional<String> getIconUrl() {
        return Optional.of("</path-to-icon/icon.png>");
    }

    /**
     * Defines a link to a detail view, if its needed. Links the title
     * of the portlet to this url.
     *
     * @return
     *          {@link java.util.Optional} of the url, or an empty Optional,
     *          if no link should be provided by portlet.
     */
    @Override
    public Optional<String> getDetailViewUrl() {
        return Optional.of("<link-to-detail-view>");
    }

    /**
     * Creates a new {@link ExamplePortletFactory}.
     */
    @Extension
    public static class ExamplePortletFactory extends MonitorPortletFactory {
        @Override
        public Collection<MonitorPortlet> getPortlets(Run<?, ?> build) {
            return Collections.singleton(new DemoPortlet(build));
        }

        @Override
        public String getDisplayName() {
            return "Demo Portlet Factory";
        }
    }
}
⭕ Null Check for used actions
Since an empty dashboard is always added by default, it is possible that the method
getPortlets(Run)will be called (e.g. open the dashboard of actual run) even though the corresponding run may not be finished. It is possible that actions have not yet been added to the run. It is therefore advisable to perform a null check on the actions of the run required by your portlet and return an empty list if necessary. (Example: code-coverage-api)
The factory can also deliver several portlets of one class.
⚠️ Unique portlet ID:The id must be unique. Please make sure that the id is related to the plugin so that there are no conflicts with other plugins. It is recommended to use the artifact id of the plugin or parts of it as prefix. If several portlets of the same class are created in the factory, it must be ensured that the ID is always unique for each portlet!
Here is an example of a factory that delivers two instances of a class:
/**
 * An example Monitor Portlet implementation with multiple portlets delivered by factory.
 */
public class DemoPortlet extends MonitorPortlet {
    private final Run<?, ?> run;
    private final String id;

    /**
     * Create a new {@link DemoPortlet}.
     *
     * @param run
     *          the {@link Run}
     * @param id
     *          the id.
     */
    public DemoPortlet(Run<?, ?> run, String id) {
        this.run = run;
        this.id = id;
    }

    @Override
    public String getTitle() {
        return "Demo Portlet " + getId();
    }

    @Override
    public String getId() {
        return id;
    }

    // other interface methods, see example above.

    /**
     * Creates a new {@link ExamplePortletFactory}.
     */
    @Extension
    public static class ExamplePortletFactory extends MonitorPortletFactory {
        @Override
        public Collection<MonitorPortlet> getPortlets(Run<?, ?> build) {
            List<MonitorPortlet> portlets = new ArrayList<>();
            portlets.add(new DemoPortlet(build, "example-portlet-first"));
            portlets.add(new DemoPortlet(build, "example-portlet-second"));
            return monitors;
        }

        @Override
        public String getDisplayName() {
            return "Demo Portlet Factory";
        }
    }
}
Each portlet have to have a corresponding monitor.jelly file, which is responsible for the content of the plugins portlet delivered on the dashboard later. Therefore you have to create a new monitor.jelly file in the directory, which corresponds to the MonitorView class.
Example: The code behind is defined in src/main/java/io/jenkins/plugins/sample/DemoPortlet.java. The related sources (e.g. the monitor.jelly file) have to be defined in src/main/resources/io/jenkins/plugins/sample/DemoPortlet/monitory.jelly.
Now the portlet, which can be added later in the dashboard, can be filled individually. Of course, all obligatory functions of the Jelly files, such as JEXL calls, can be used. To do this, please refer to the official Jenkins documentation. A minimal example:
<?jelly escape-by-default='true'?>

<j:jelly xmlns:j="jelly:core">

    <p>Portlet content goes here!</p>

</j:jelly>
This plugin offers the following monitoring options:
- project level: MonitoringMultibranchProjectAction
- build level: MonitoringBuildAction
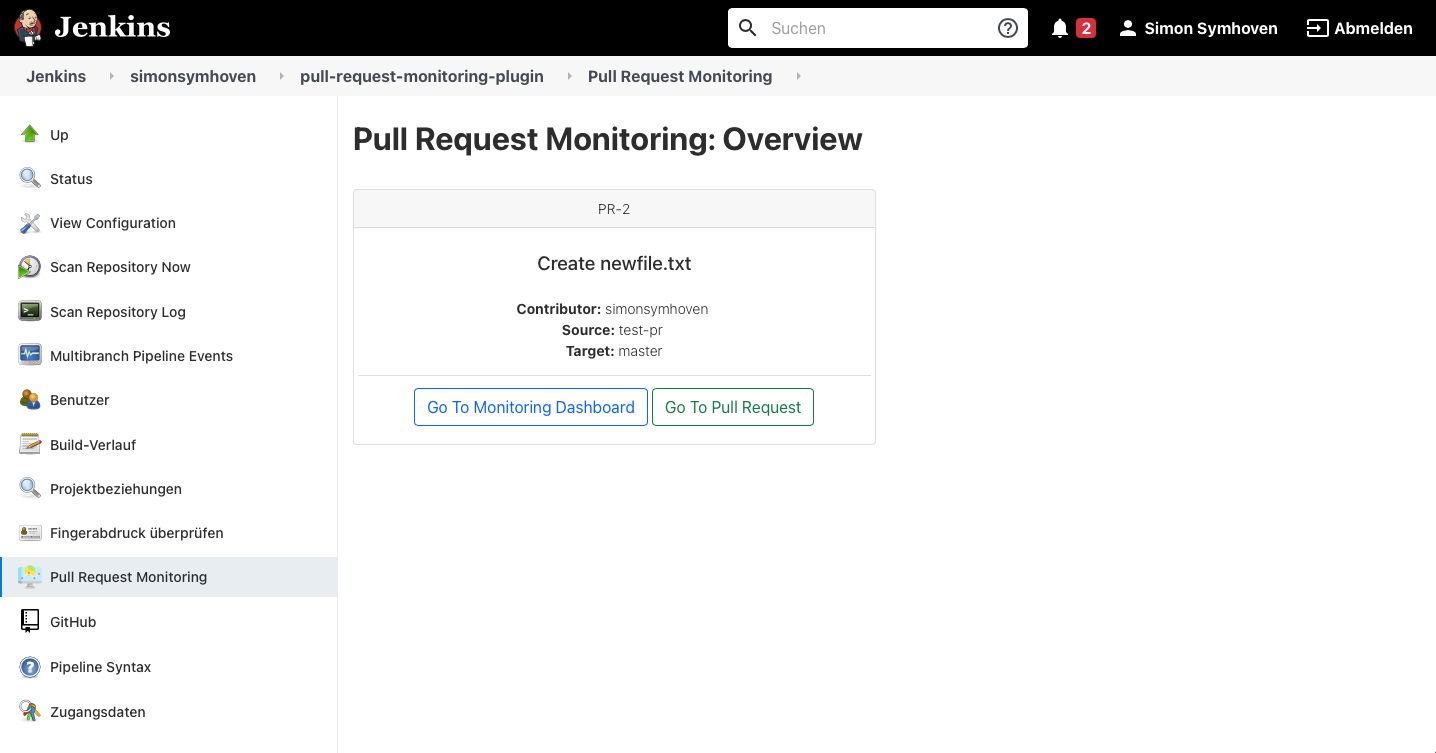
The monitoring on the project level is very basic and is limited to the summary of all open pull requests of the associated SCM. From here, you can access the corresponding monitoring dashboards, view the pull request information and navigate to the respective pull request in the repository.
The monitoring at build level is the core of the plugin and offers the possibility to observe various delta metrics of a pull request provided by other portlets.
The dashboard is only added to those builds whose branch SCMHead of the parent job is an instance of ChangeRequestSCMHead. Otherwise, the corresponding MonitoringBuildAction will not be added and no dashboard will be provided for the build. For more details, please refer to the logging in the console output of the respective build.
The configuration, which is set via the Jenkinsfile or via the Dahsboard, is saved per user as a hudson.model.UserProperty and is browser independent. The plugin therefore requires that you are logged in and have the appropriate permissions. Otherwise, the action will not be displayed!
💡 Reference build search:
The git-forensics-api plugin allows to find a reference build for a pull request build. It is highly recommended using this plugin and to search for the reference build in the pipeline with
discoverGitReferenceBuild()(or configure it via the Jenkins UI). For more information please visit the plugin page or have a look into an example pipeline.
To start with the default dashboard, you have to do nothing. If the run is part of a pull request, the corresponding MonitoringDefaultAction is automatically added to the Run and later available on the sidepanel of the run.
Now you are able to add portlets to the dashboard, change the layout or remove it again. The configuration will be saved for each project per user. If you want to save the configuration permanently, it is best to copy and paste it into the Jenkinsfile and overwrite the default dashboard and use a custom dashboard.
🧩 Default Portlets for Dashboard:
Since version 1.7.0, the portlets can decide whether they should be displayed by default or not in the user dashboard. So when you start with the default dashboard, all available portlets that are marked as default are automatically loaded into your dashboard.
The other way to add a dashboard is to set the configuration of the dashboard via the Jenkinsfile to pre-define your dashboard. It is recommended to add the monitoring at the end of your pipeline, to ensure that other plugins such as static code analysis are performed first and that the actions that may be required are available:
stage ('Pull Request Monitoring - Dashboard Configuration') {
    monitoring (
        '''
        [
            {
                // Minimal usage of one portlet
                "id": "portlet-id"
            },
            {
                // Feel free to customize the portlets
                "id": "another-portlet-id",
                "width": 200,
                "height": 100,
                "color": "#FF5733"
            }
        ]
        '''
 )
}
Therefore, the monitoring stage expects a JSONArray of JSONObjects. To validate your configured json, you could use a JSON Schema Validator and the corresponding JSON schema used for this plugin. Each JSONObject needs at least the id of the portlet to add. For width and height, the default preferredWidth and preferredHeight of the MonitorPortlet is used. #000000 is used as default color.
The dashboard will be added to your Run and the pre-defined monitor should be available.
🔥 Duplicate or missing portlet IDs:
Duplicates will be removed as well as missing portlet ids. The
Runwill not fail unless the provided json does not follow the scheme!
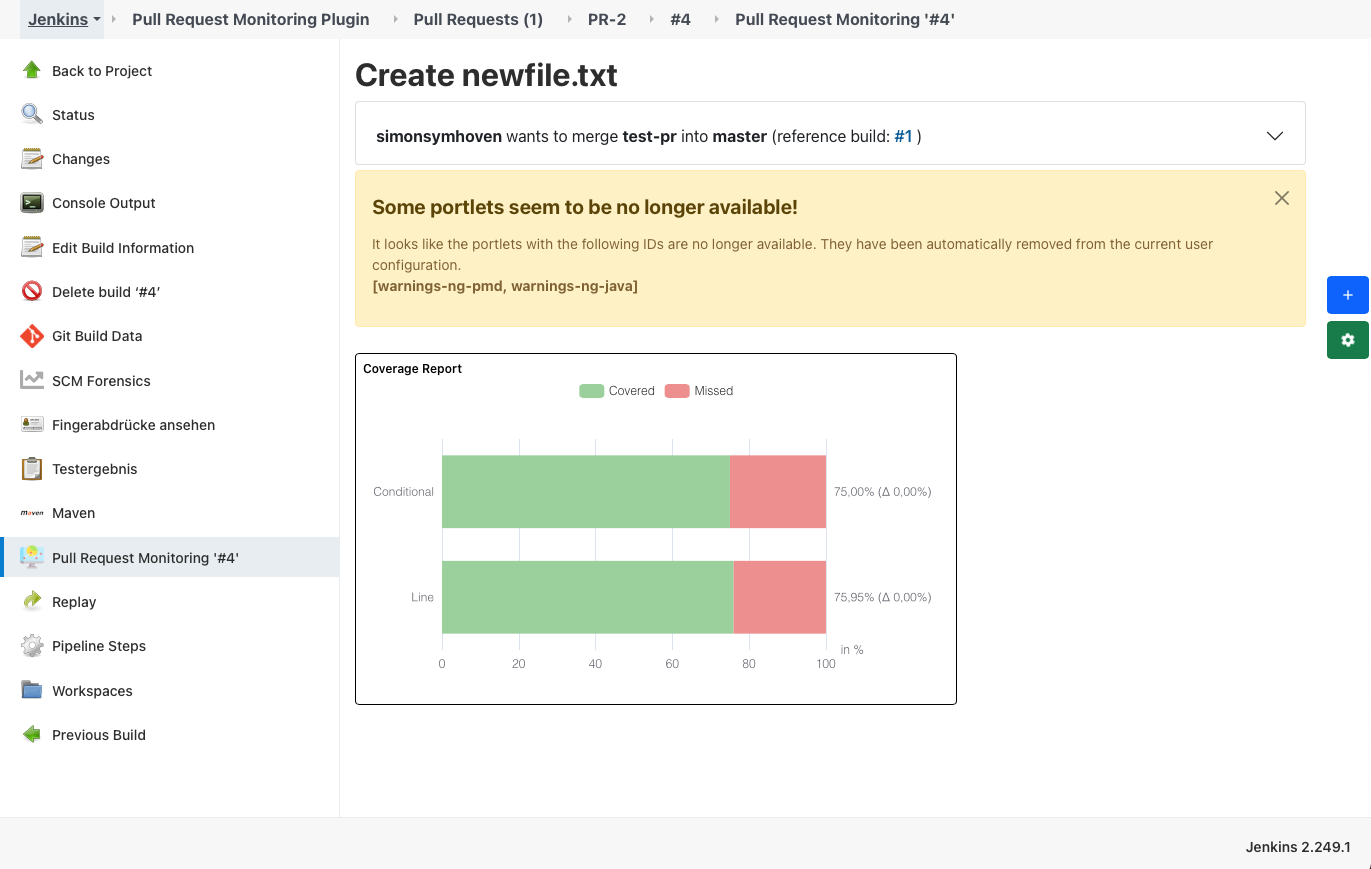
If there are unavailable portlets (e.g. corresponding plugin is uninstalled) in stored user configuration, and the dashboard tries to load this portlet, an alert will be displayed with the ids of the unavailable portlets:
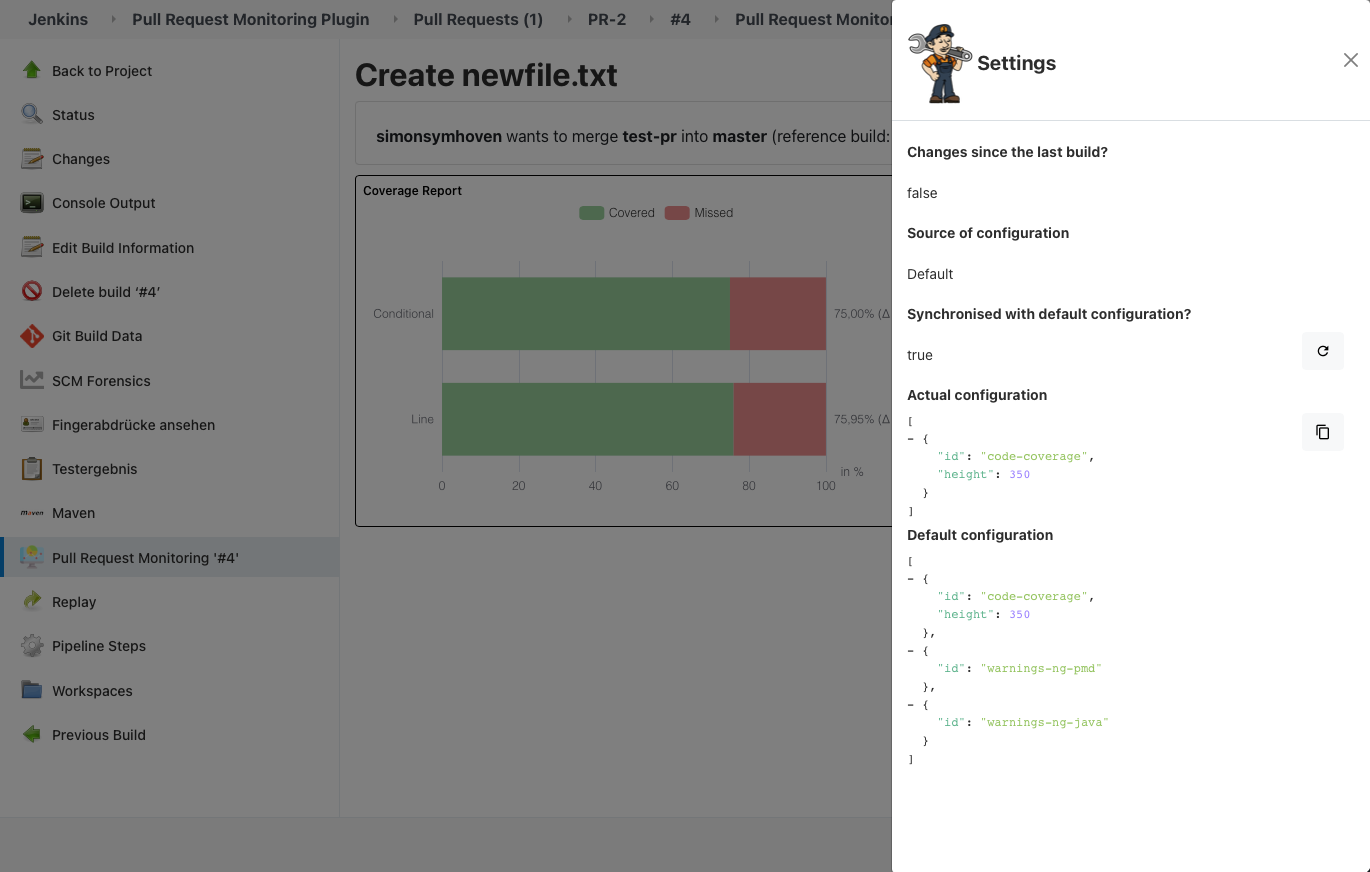
Under the settings of each Run, various things can be tracked:
-
Are there changes of the pre-defined dashboard since the last build?
-
The current activated source of configuration (Default or User-specific).
-
Default means Jenkinsfile if
monitoringis provided, else all available default portlets. -
User-specific means the local changes of dashboard.
-
-
Configuration synced with the default one? If needed, you can synchronize the actual configuration with the default one.
-
The actual configuration
-
The default configuration.
❗Prioritising of the different configurations:
By default, all available default portlets are loaded. If there is a user-specific configuration for one dashboard (per project), the user-specific configuration will be loaded per default. If you sync the current configuration with the default one, the user-specific configuration for current dashboard will be deleted, and the default configuration will be loaded. Deletion cannot be undone!
If your plugin is not in the list but provides a portlet, feel free to add it with a pull request!
| Plugin | Number of delivered portlets | Portlet ID | Default? | |
|---|---|---|---|---|
| Pull Request Monitoring | 2 | first-demo-portlet second-demo-portlet |
❌ | |
 |
Warnings Next Generation | ≥ 100 | depends on tool | ✅ |
 |
Code Coverage API | 1 | code-coverage |
✅ |
For the demo (v1.3.0-beta) I added two recorder (javadoc and pmd) of the Warnings Ng Plugin to the pipeline and added both as default portlet to the monitoring. After the run finished, the portlets will be shown in the dashboard.
See the open issues for a list of proposed features (and known issues).
Contributions are what make the open source community such an amazing place to be learn, inspire, and create. Any contributions you make are greatly appreciated.
- Fork the Project
- Create your Feature Branch (
git checkout -b feature/AmazingFeature) - Commit your Changes (
git commit -m 'Add some AmazingFeature') - Push to the Branch (
git push origin feature/AmazingFeature) - Open a Pull Request
Distributed under the MIT License. See LICENSE for more information.
The following icons, which are used by this plugin
made by Freepik from Flaticon.
Simon Symhoven - post@simon-symhoven.de
Project Link: https://github.com/jenkinsci/pull-request-monitoring-plugin


