DevOps Insights Overview
This plugin lets you integrate Jenkins with IBM DevOps Insights. DevOps Insights tracks your deployment risk based on the test data that you publish to it. This test data may include unit tests, code coverage, functional verification tests, SonarQube data, and scan data from IBM Application Security on Cloud. Once you publish this data, you can add gates to your pipelines so that you can stop builds that don't meet risk policies.
You can also use DevOps Insights to analyze your code repositories, which can yield valuable information about error-prone files, commit trends, and team dynamics.
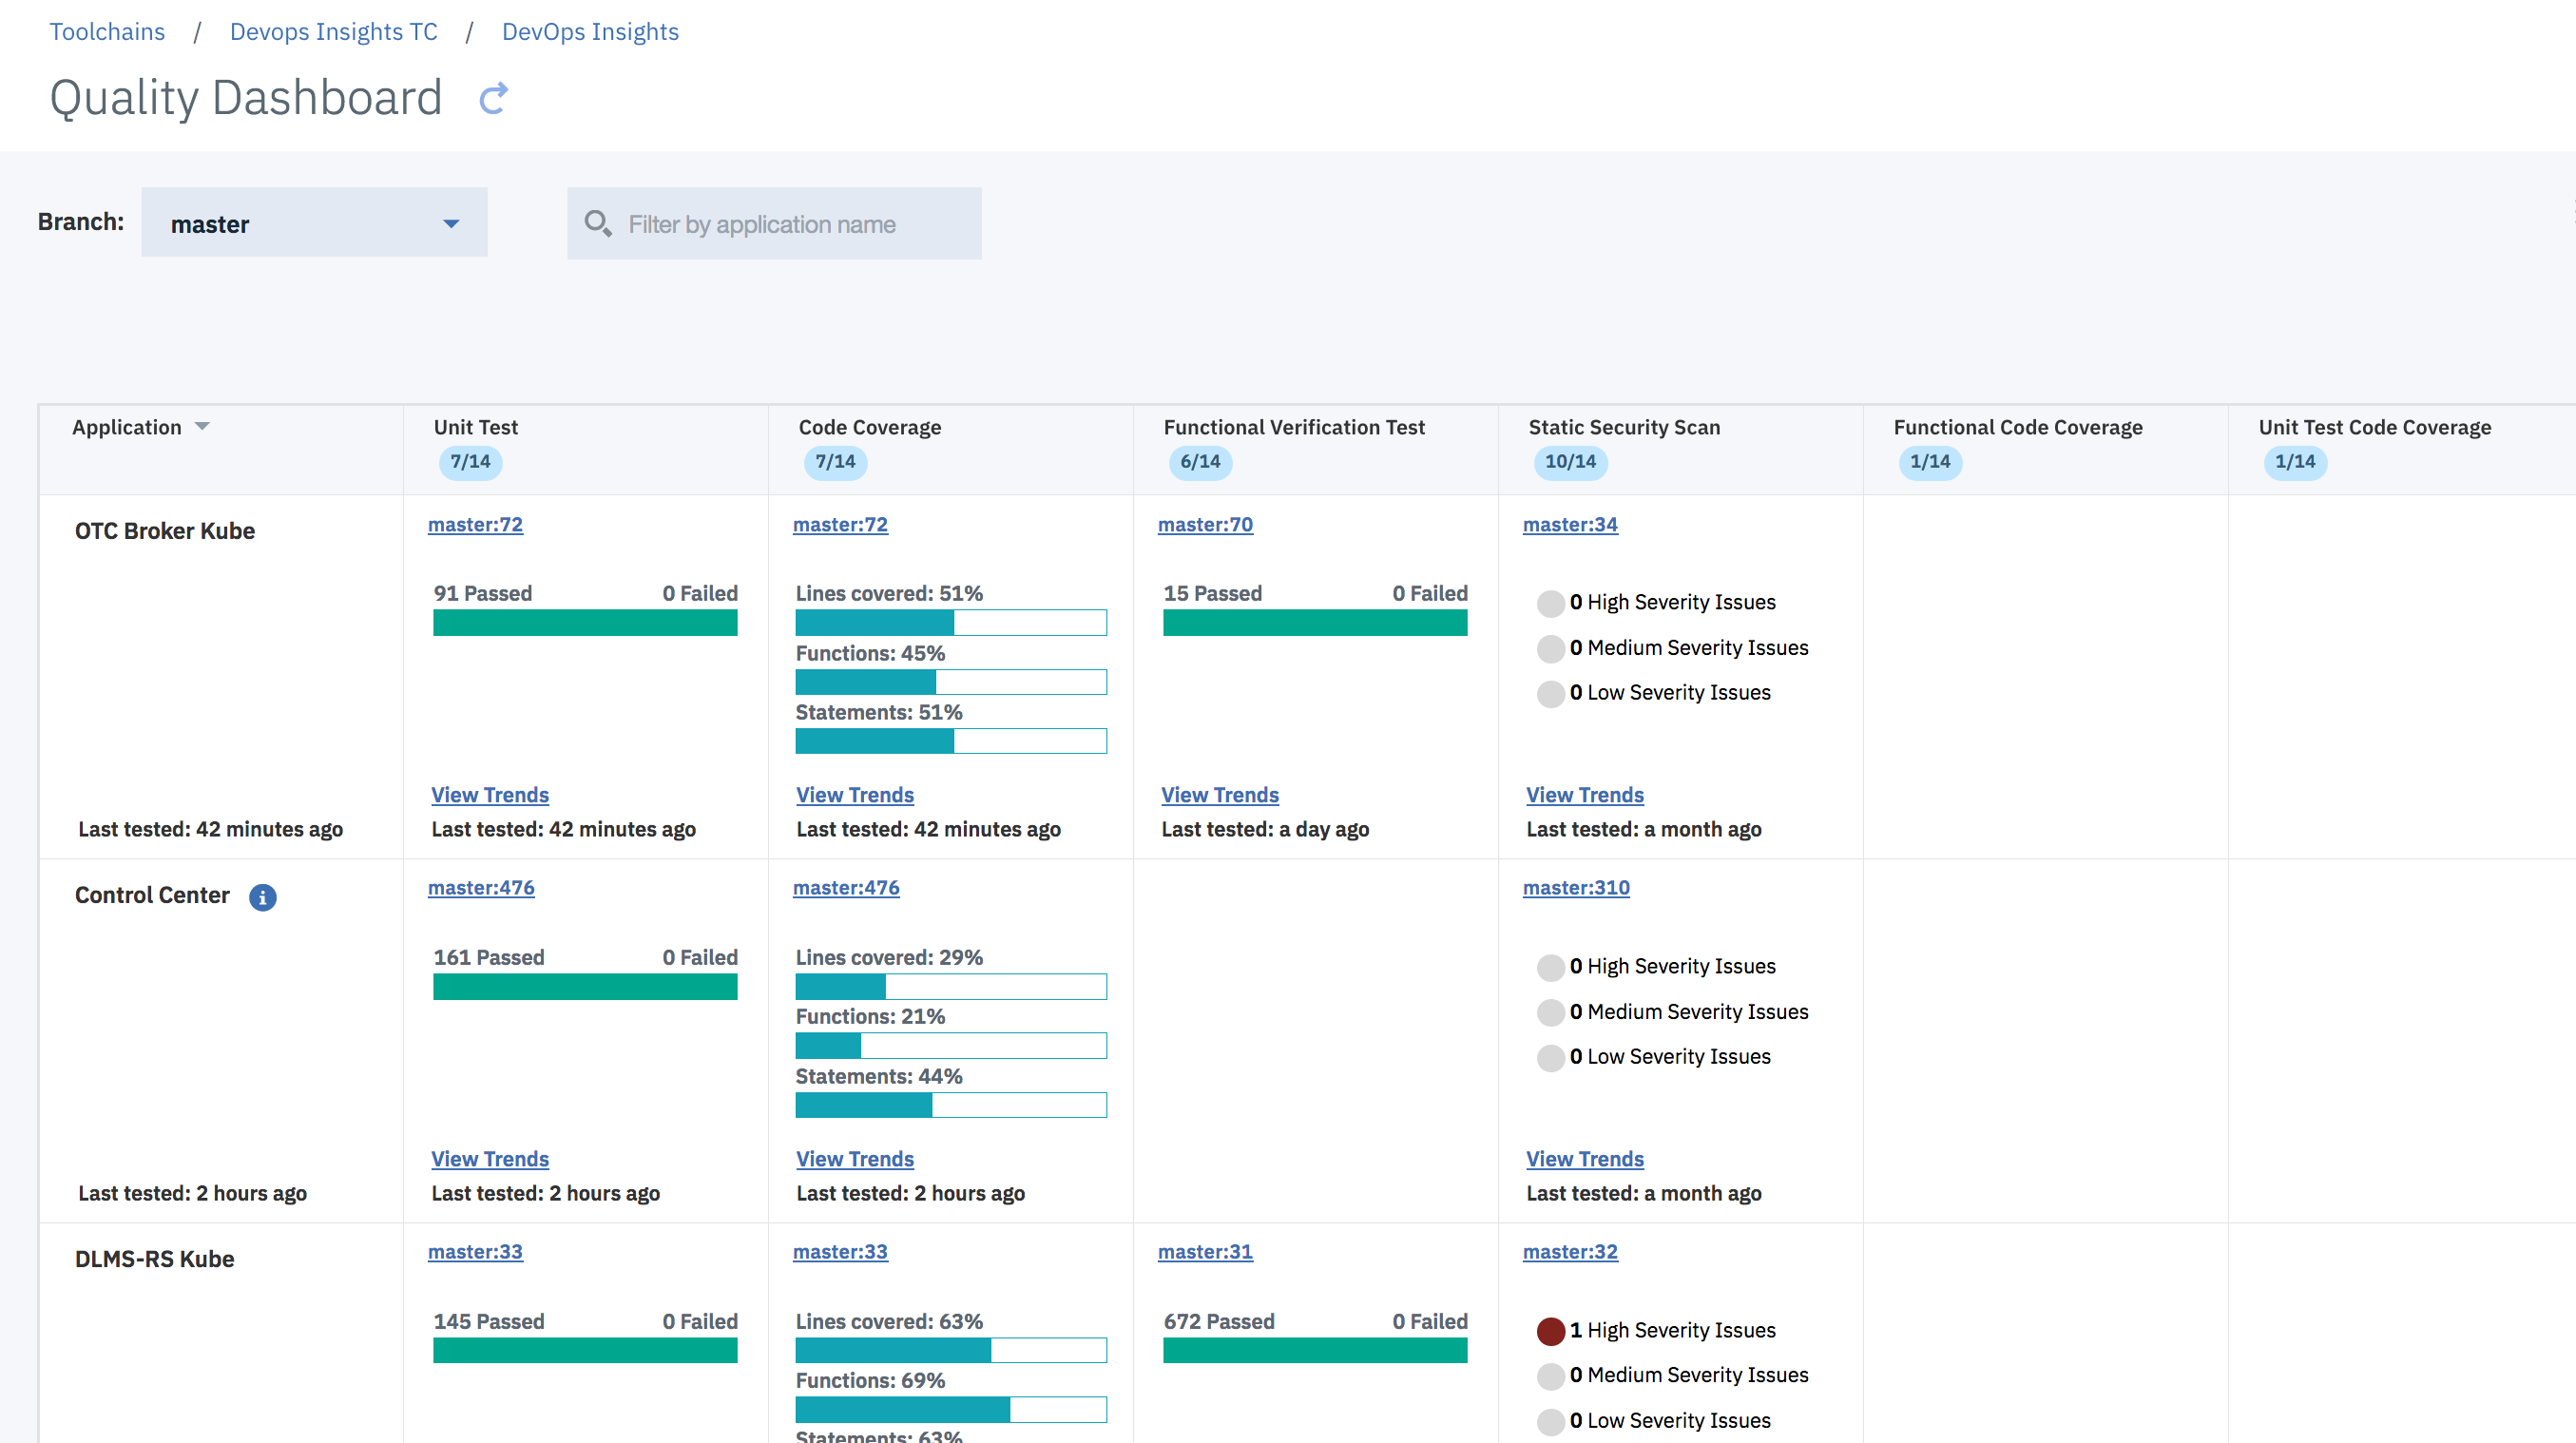
Here is the Quality Dashboard view that shows which Applications perform which type of tests. For example, synthetic-agent does Code Coverage, Unit Test, Functional Verification Test but does not perform SonarQube tests. From this view, you can also navigate to trends graph so that you can see trends for a specific application for a specific test type.
 {height="400"}
The Quality Data Set view can show quality data by a specific branch. If you use multiple branches for various environments, you can view this data by branch.
The tool lets you specify the types of tests (Data Sets) that you want to represent in the system with just a few clicks. In the above screenshot, the user has created "Sandbox Unit Test", "Upgrade Verification Test" etc. Once you define a Data Set, you can create a policy with rules around the Data Set. Once you start populating data for a Data Set, the Data Set will appear in the Quality Dashboard when your pipeline runs. You can also reorder the columns of the Quality Dashboard.
You can define one more policies that can be used to determine if a specific build should be promoted to the next environment. Since applications in a project have different levels of maturity, you can create separate policies for each application or even have multiple policies for a single application. Each policy has one or more rules.
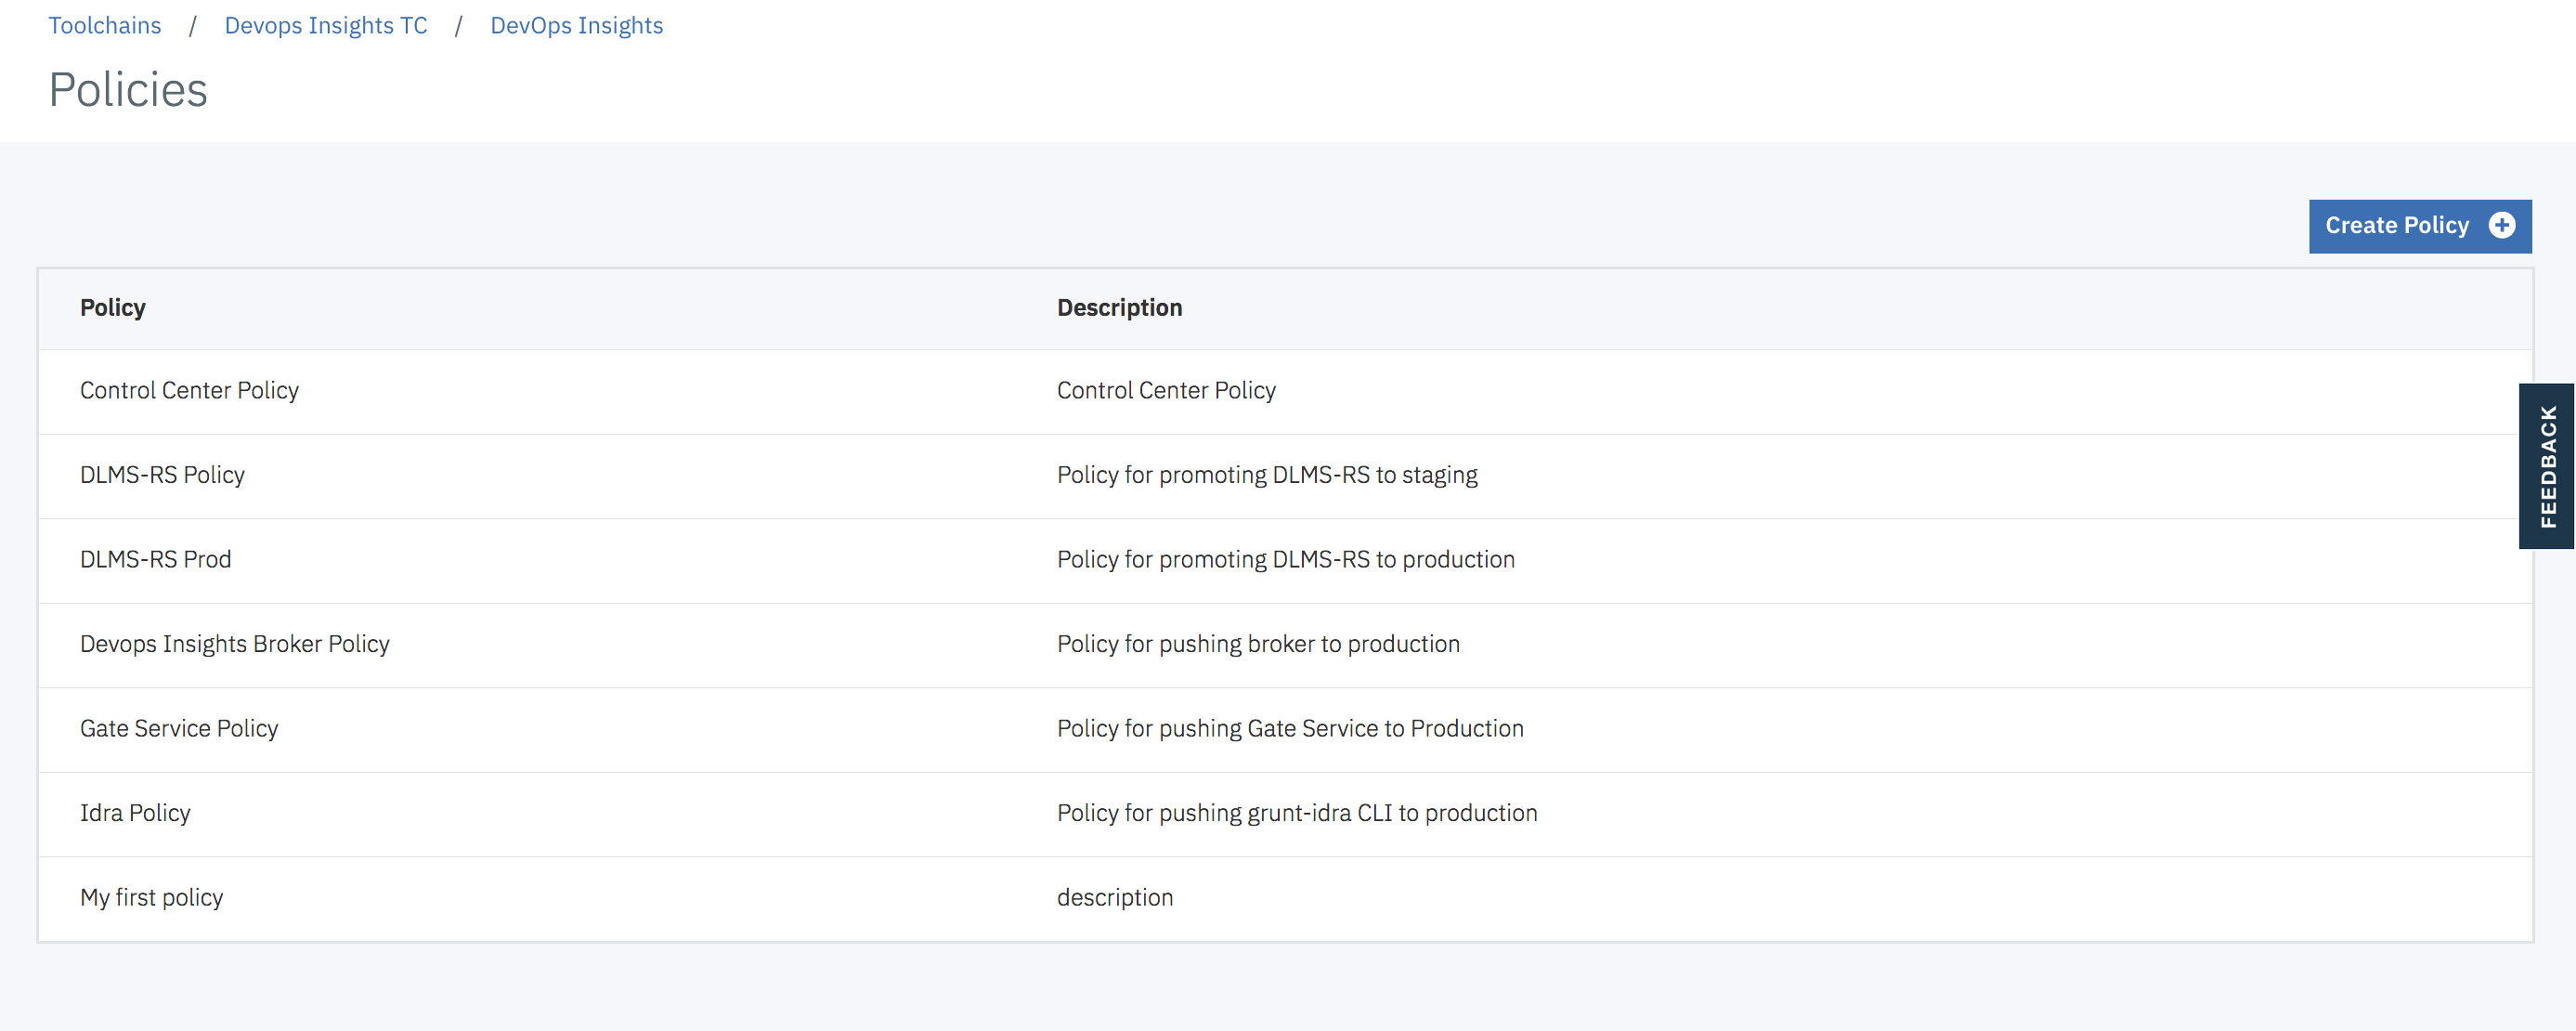
This is an example of a policy containing seven rules.
 {width="700"}
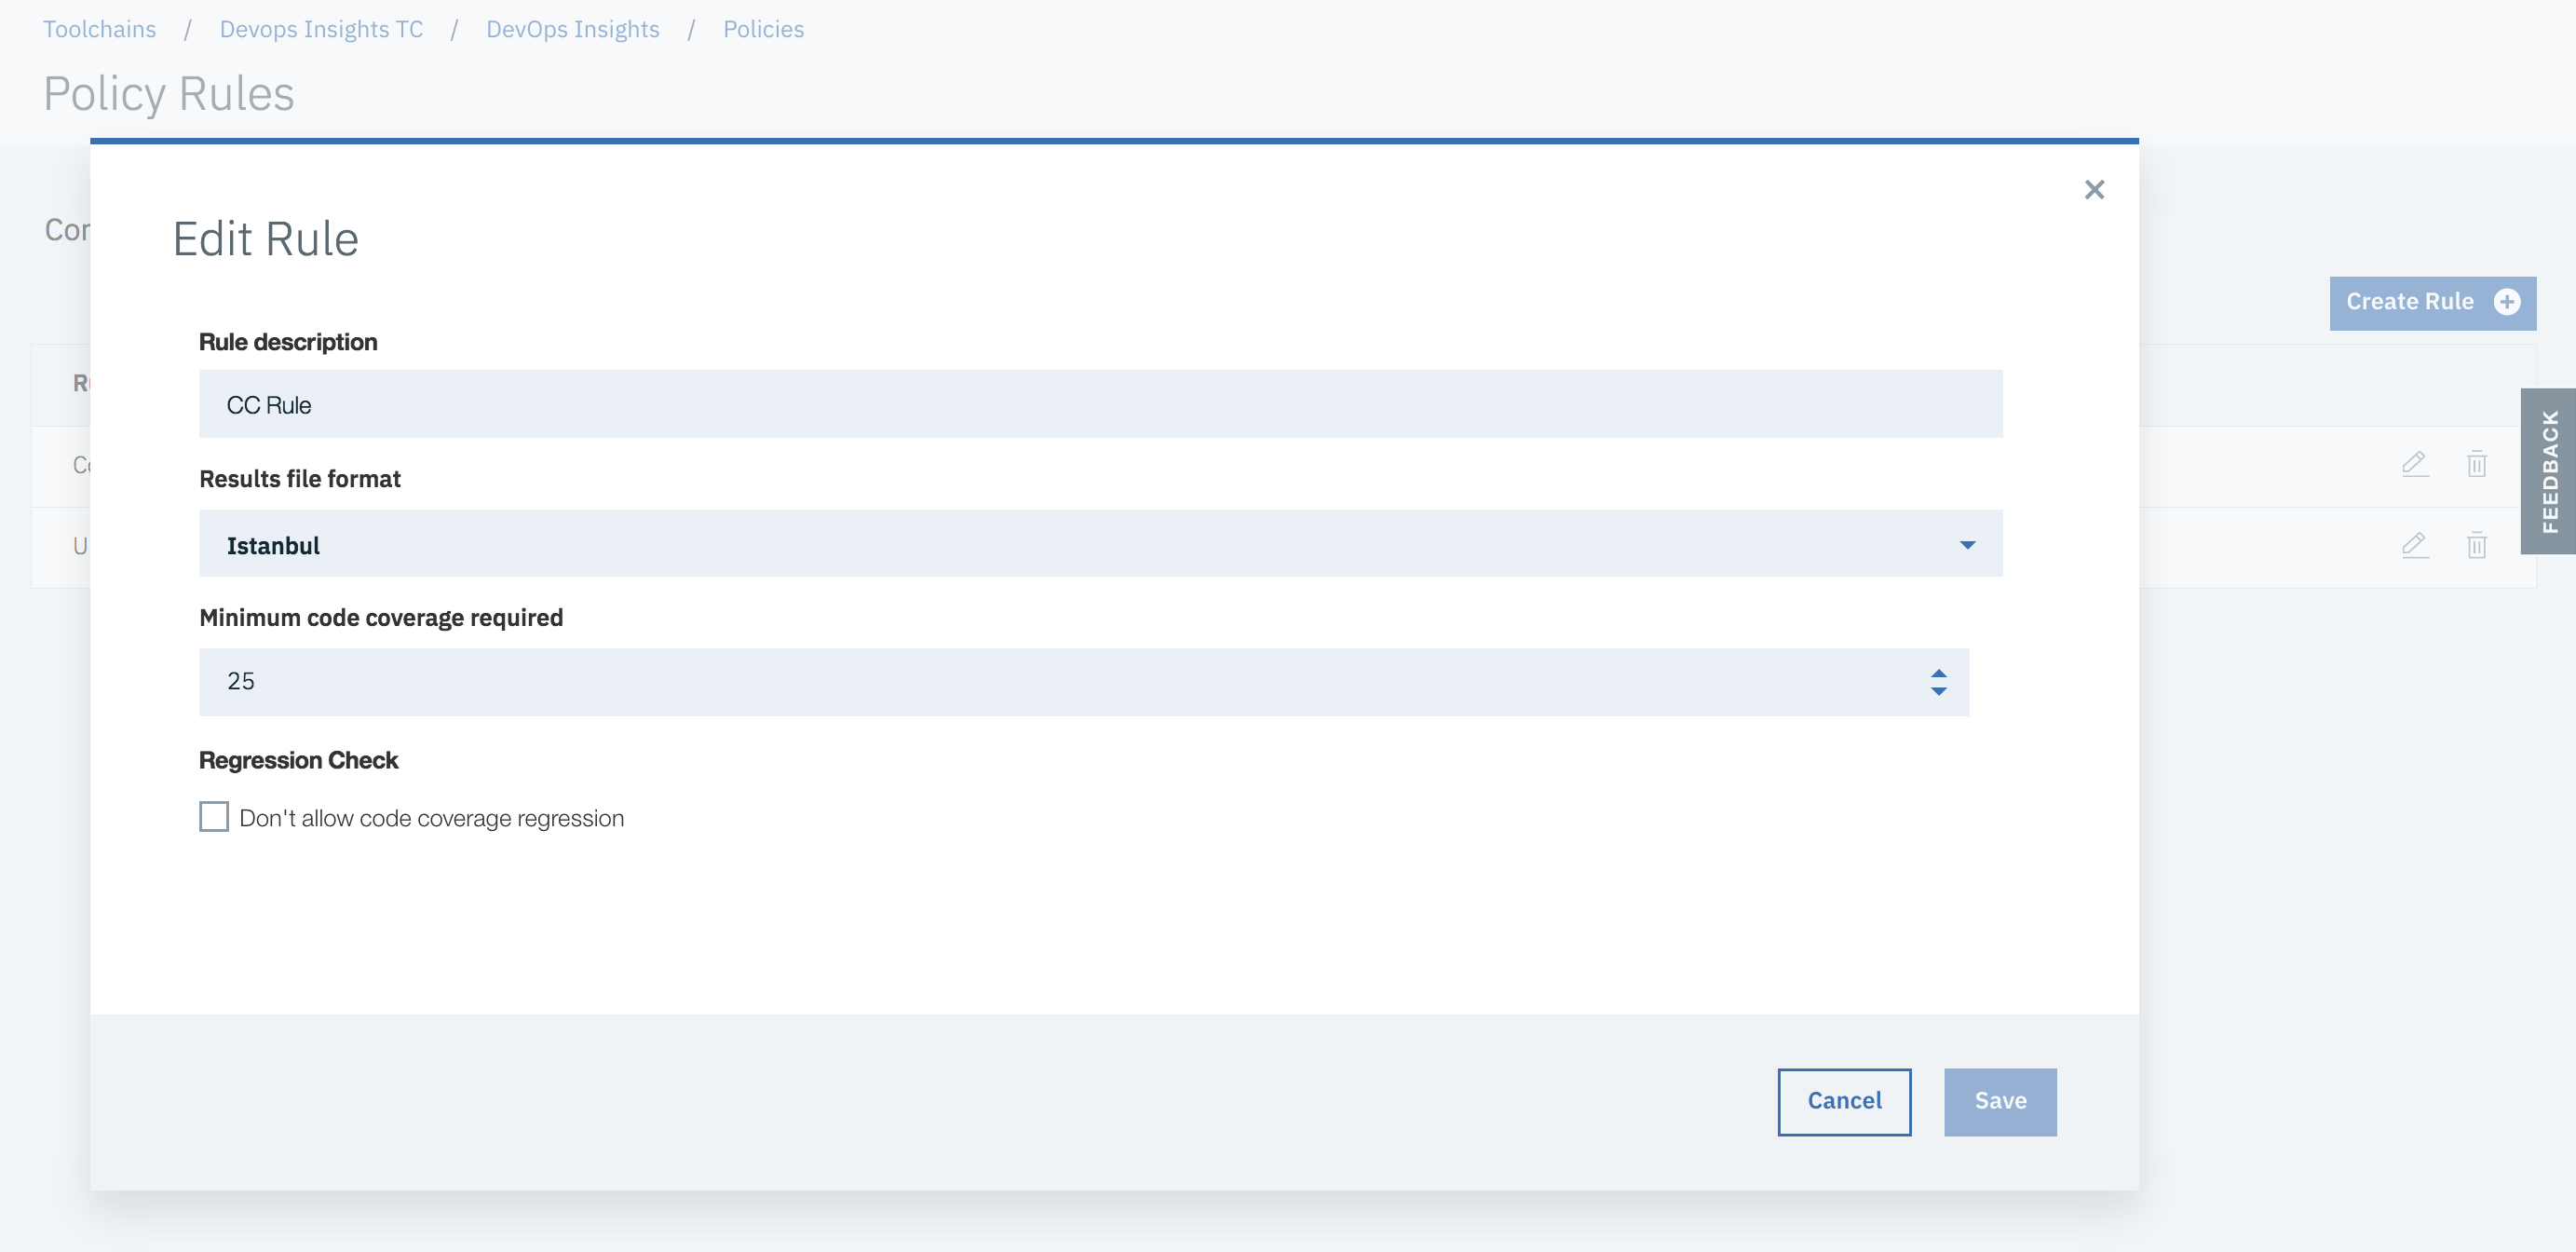
This is an example of a Code Coverage rule.
 {width="700"}
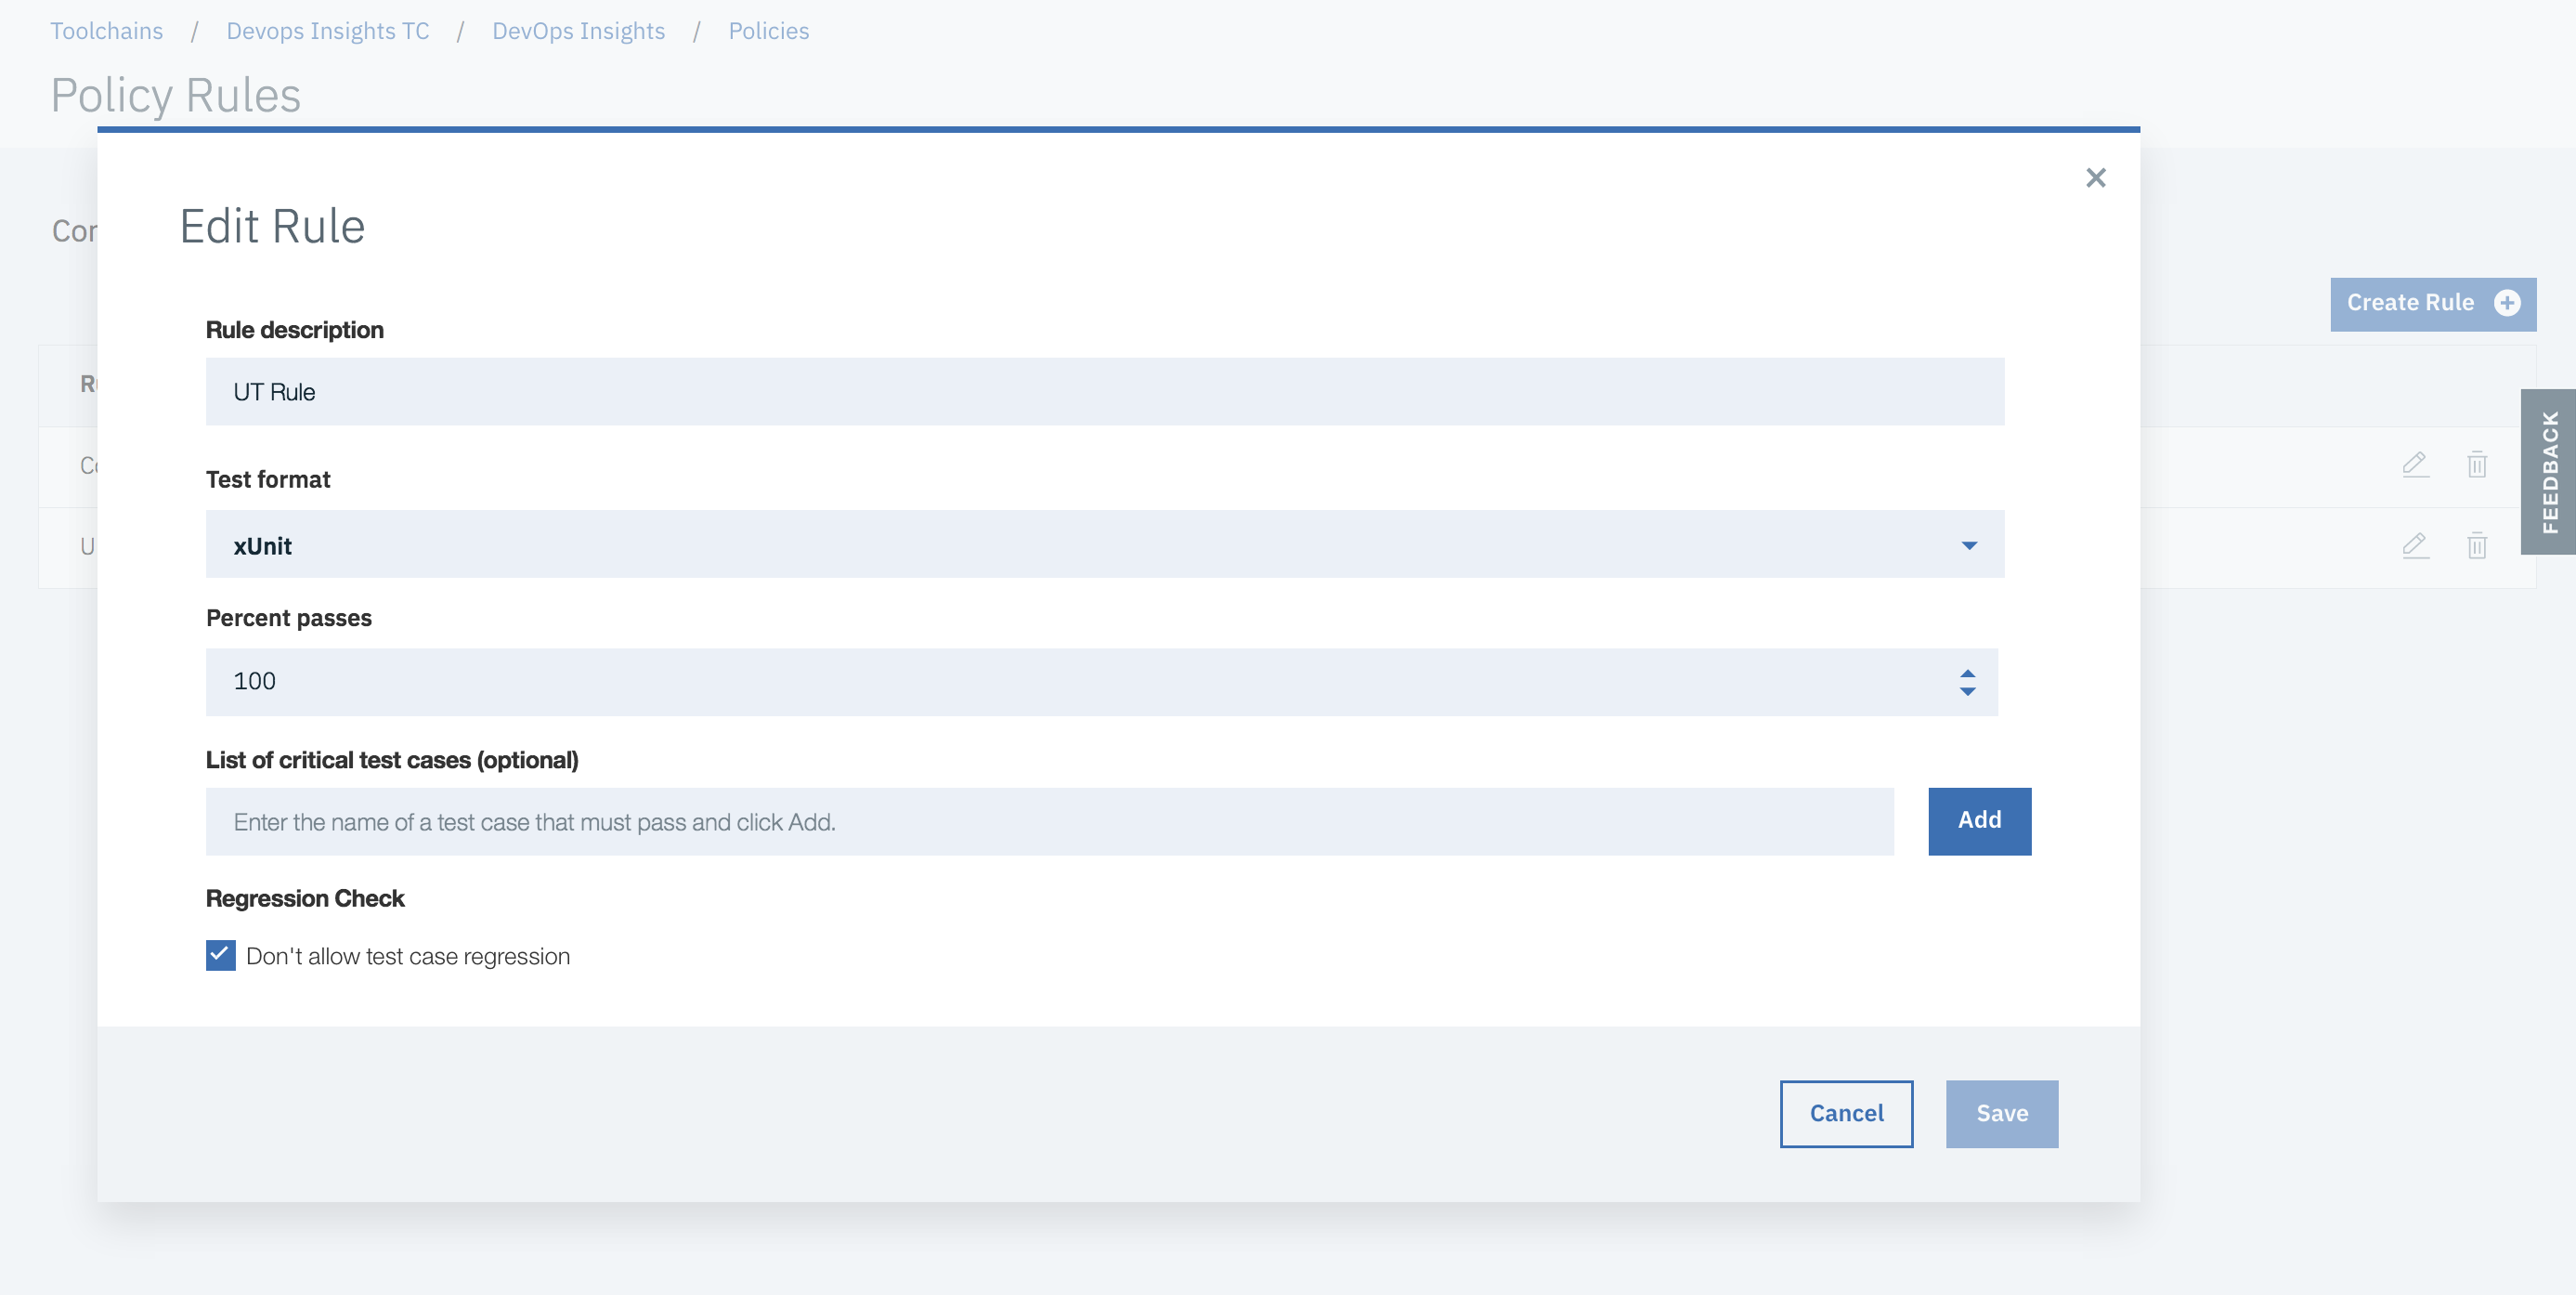
This is an example of a Unit Test rule:
 {width="700"}
You can also create rules on any custom Data Sets that you created. For example, if you created a Data Set for "Integration Test", you can create a rule for that Data Set in your policies.
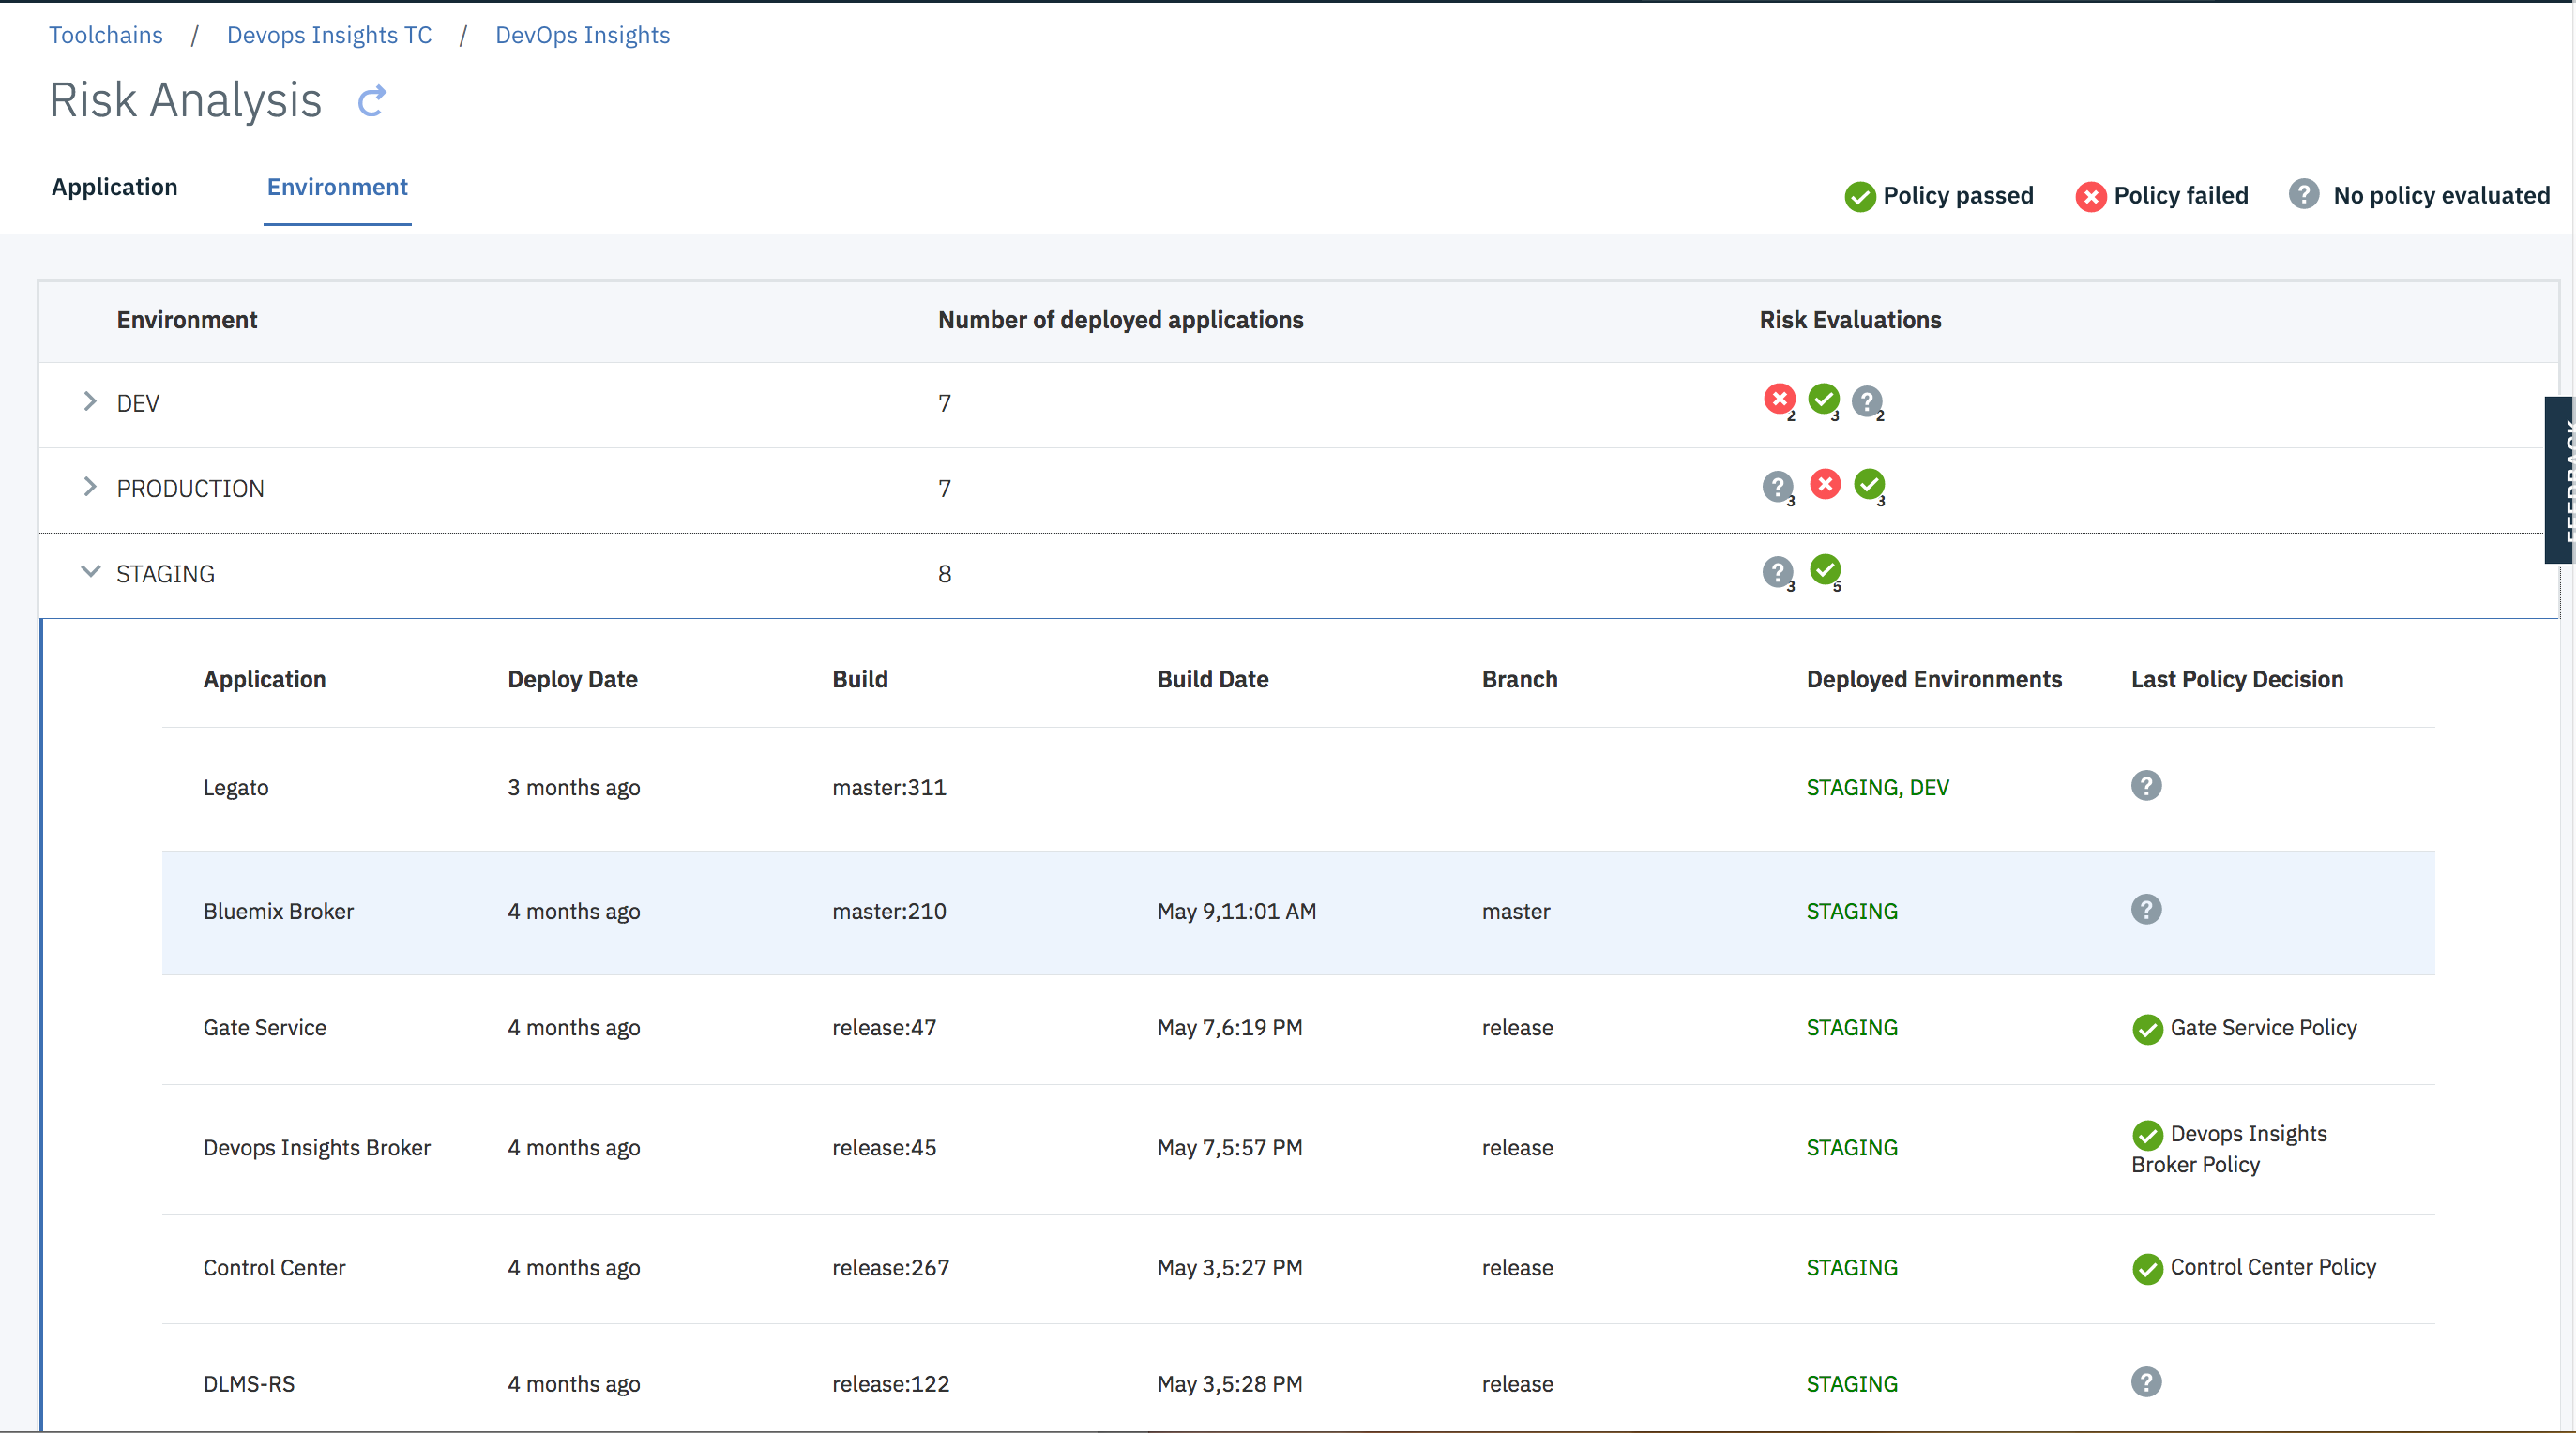
Here is a view that shows deployment risk associated with various microservices that are deployed in an environment.
 {width="700"}
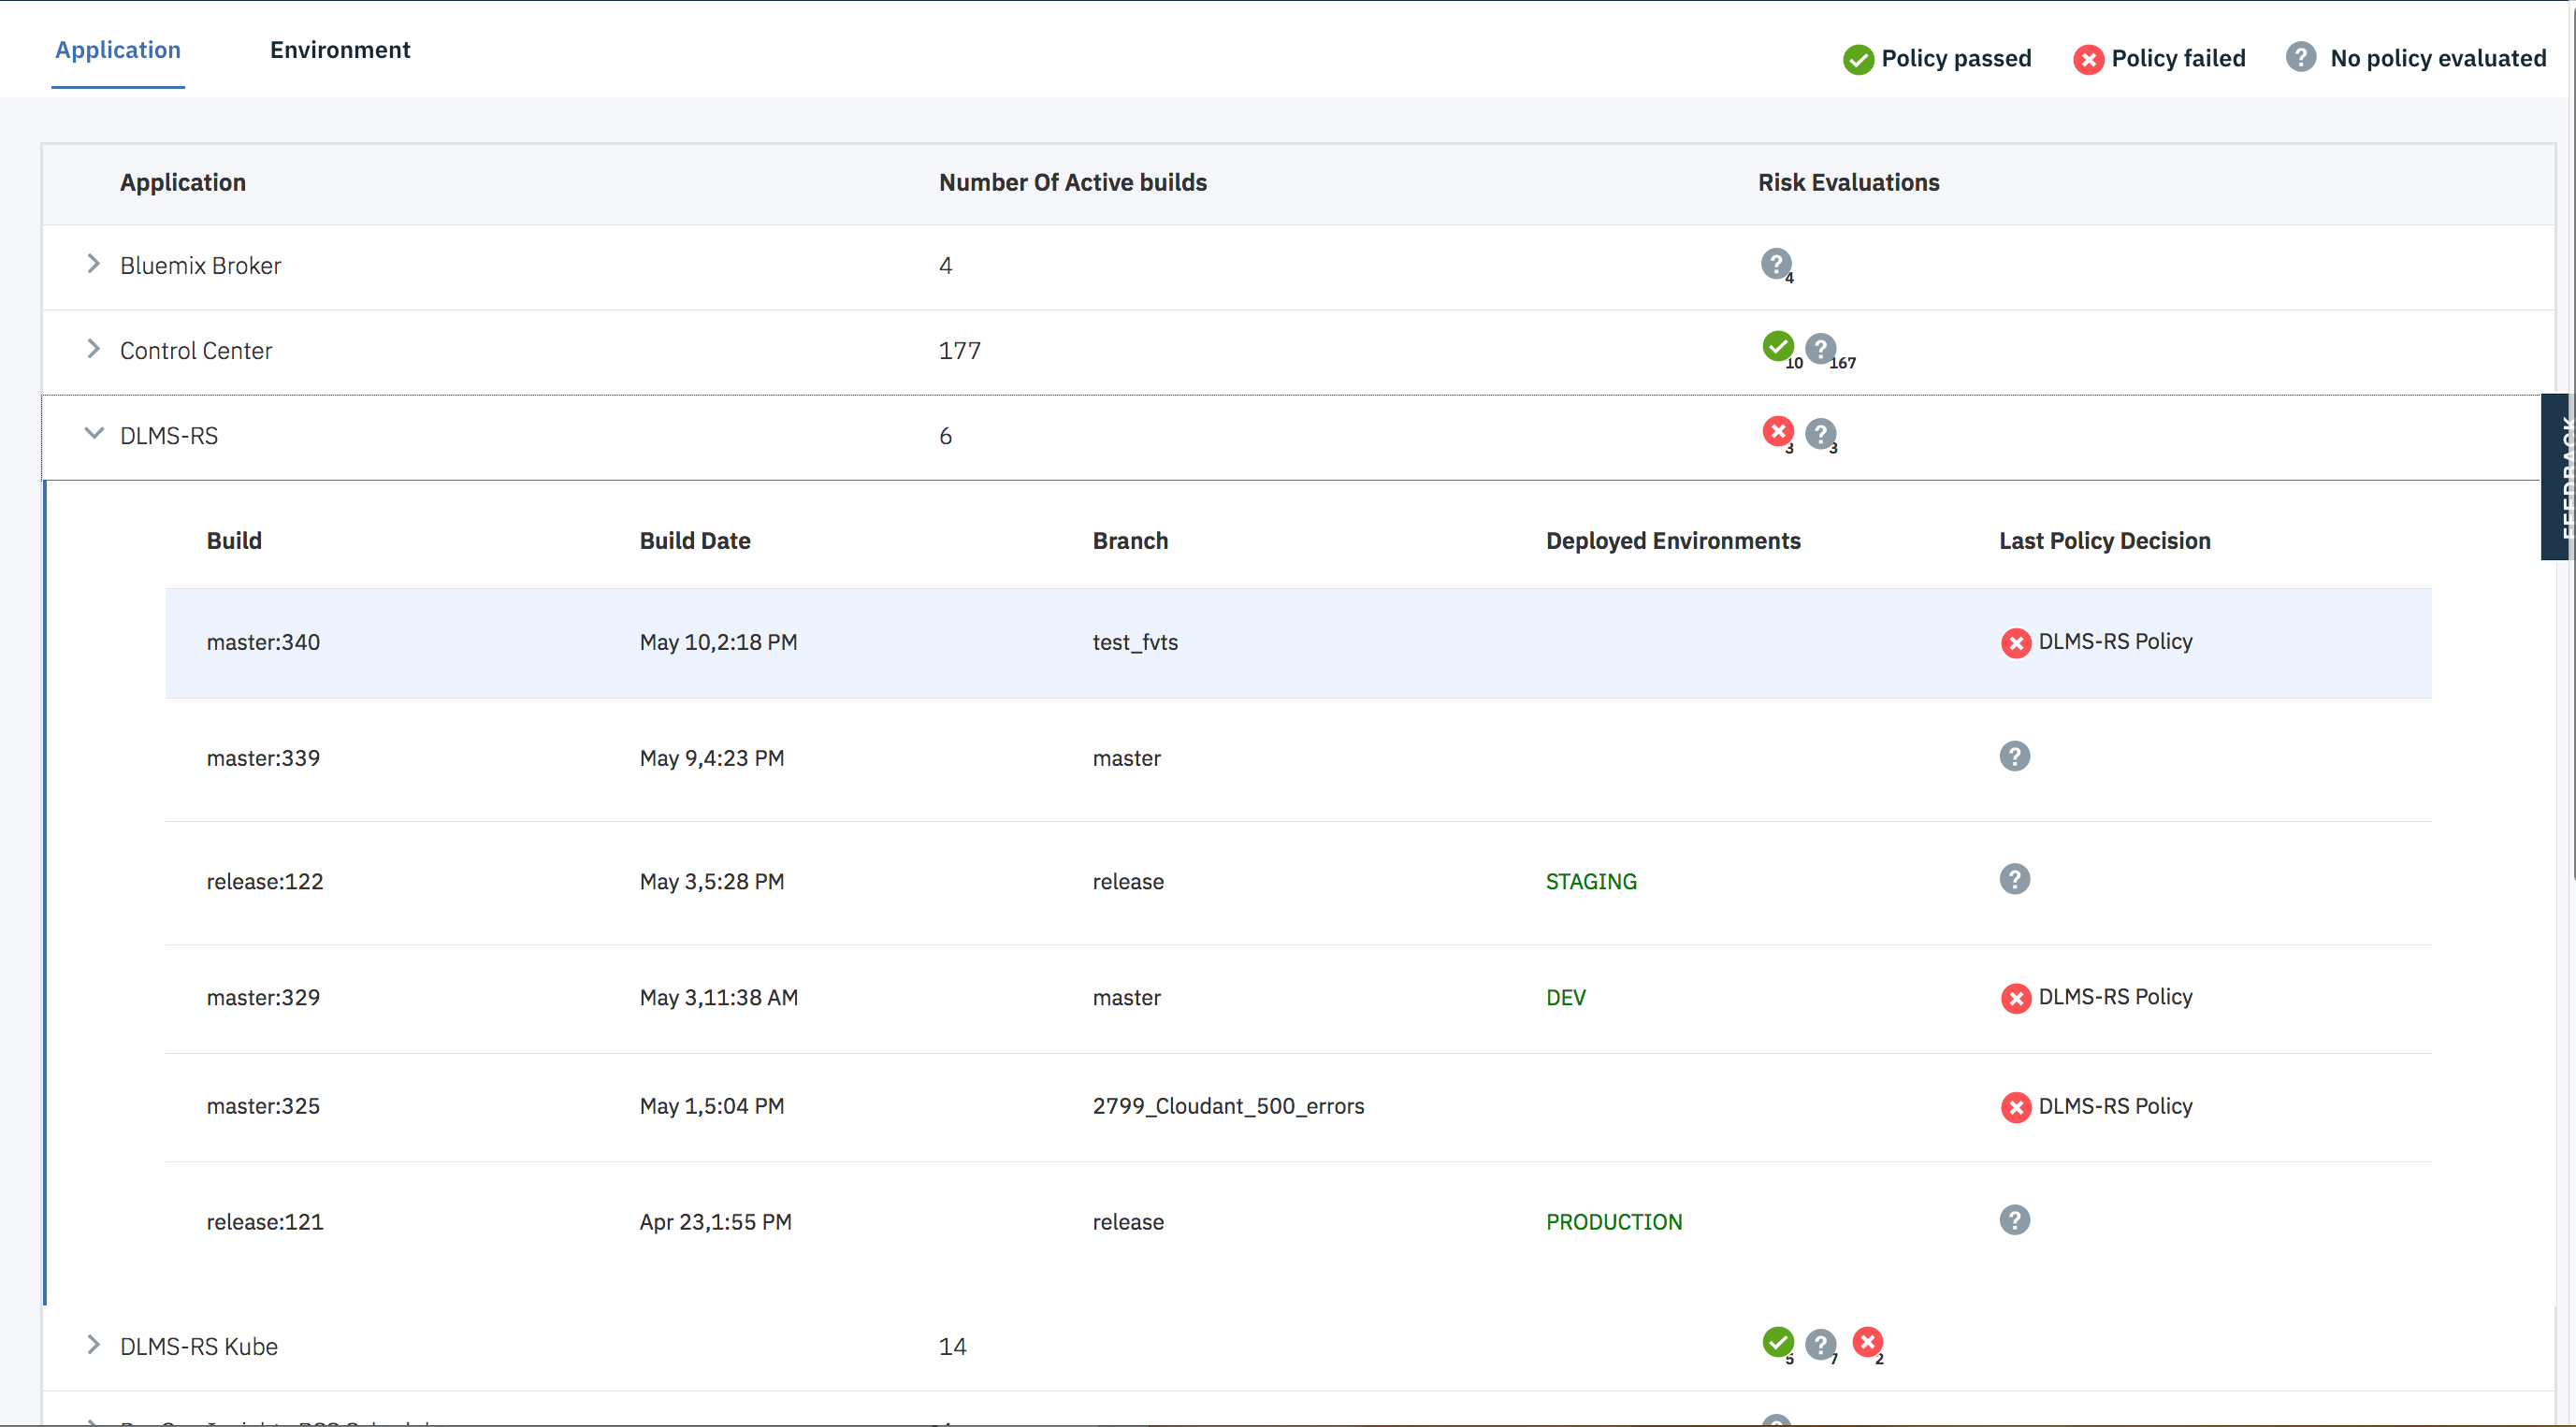
Here is a view that shows deployment risk. This view shows all builds that are in flight for a given Microservice and their deployment risk.
 {width="700"}
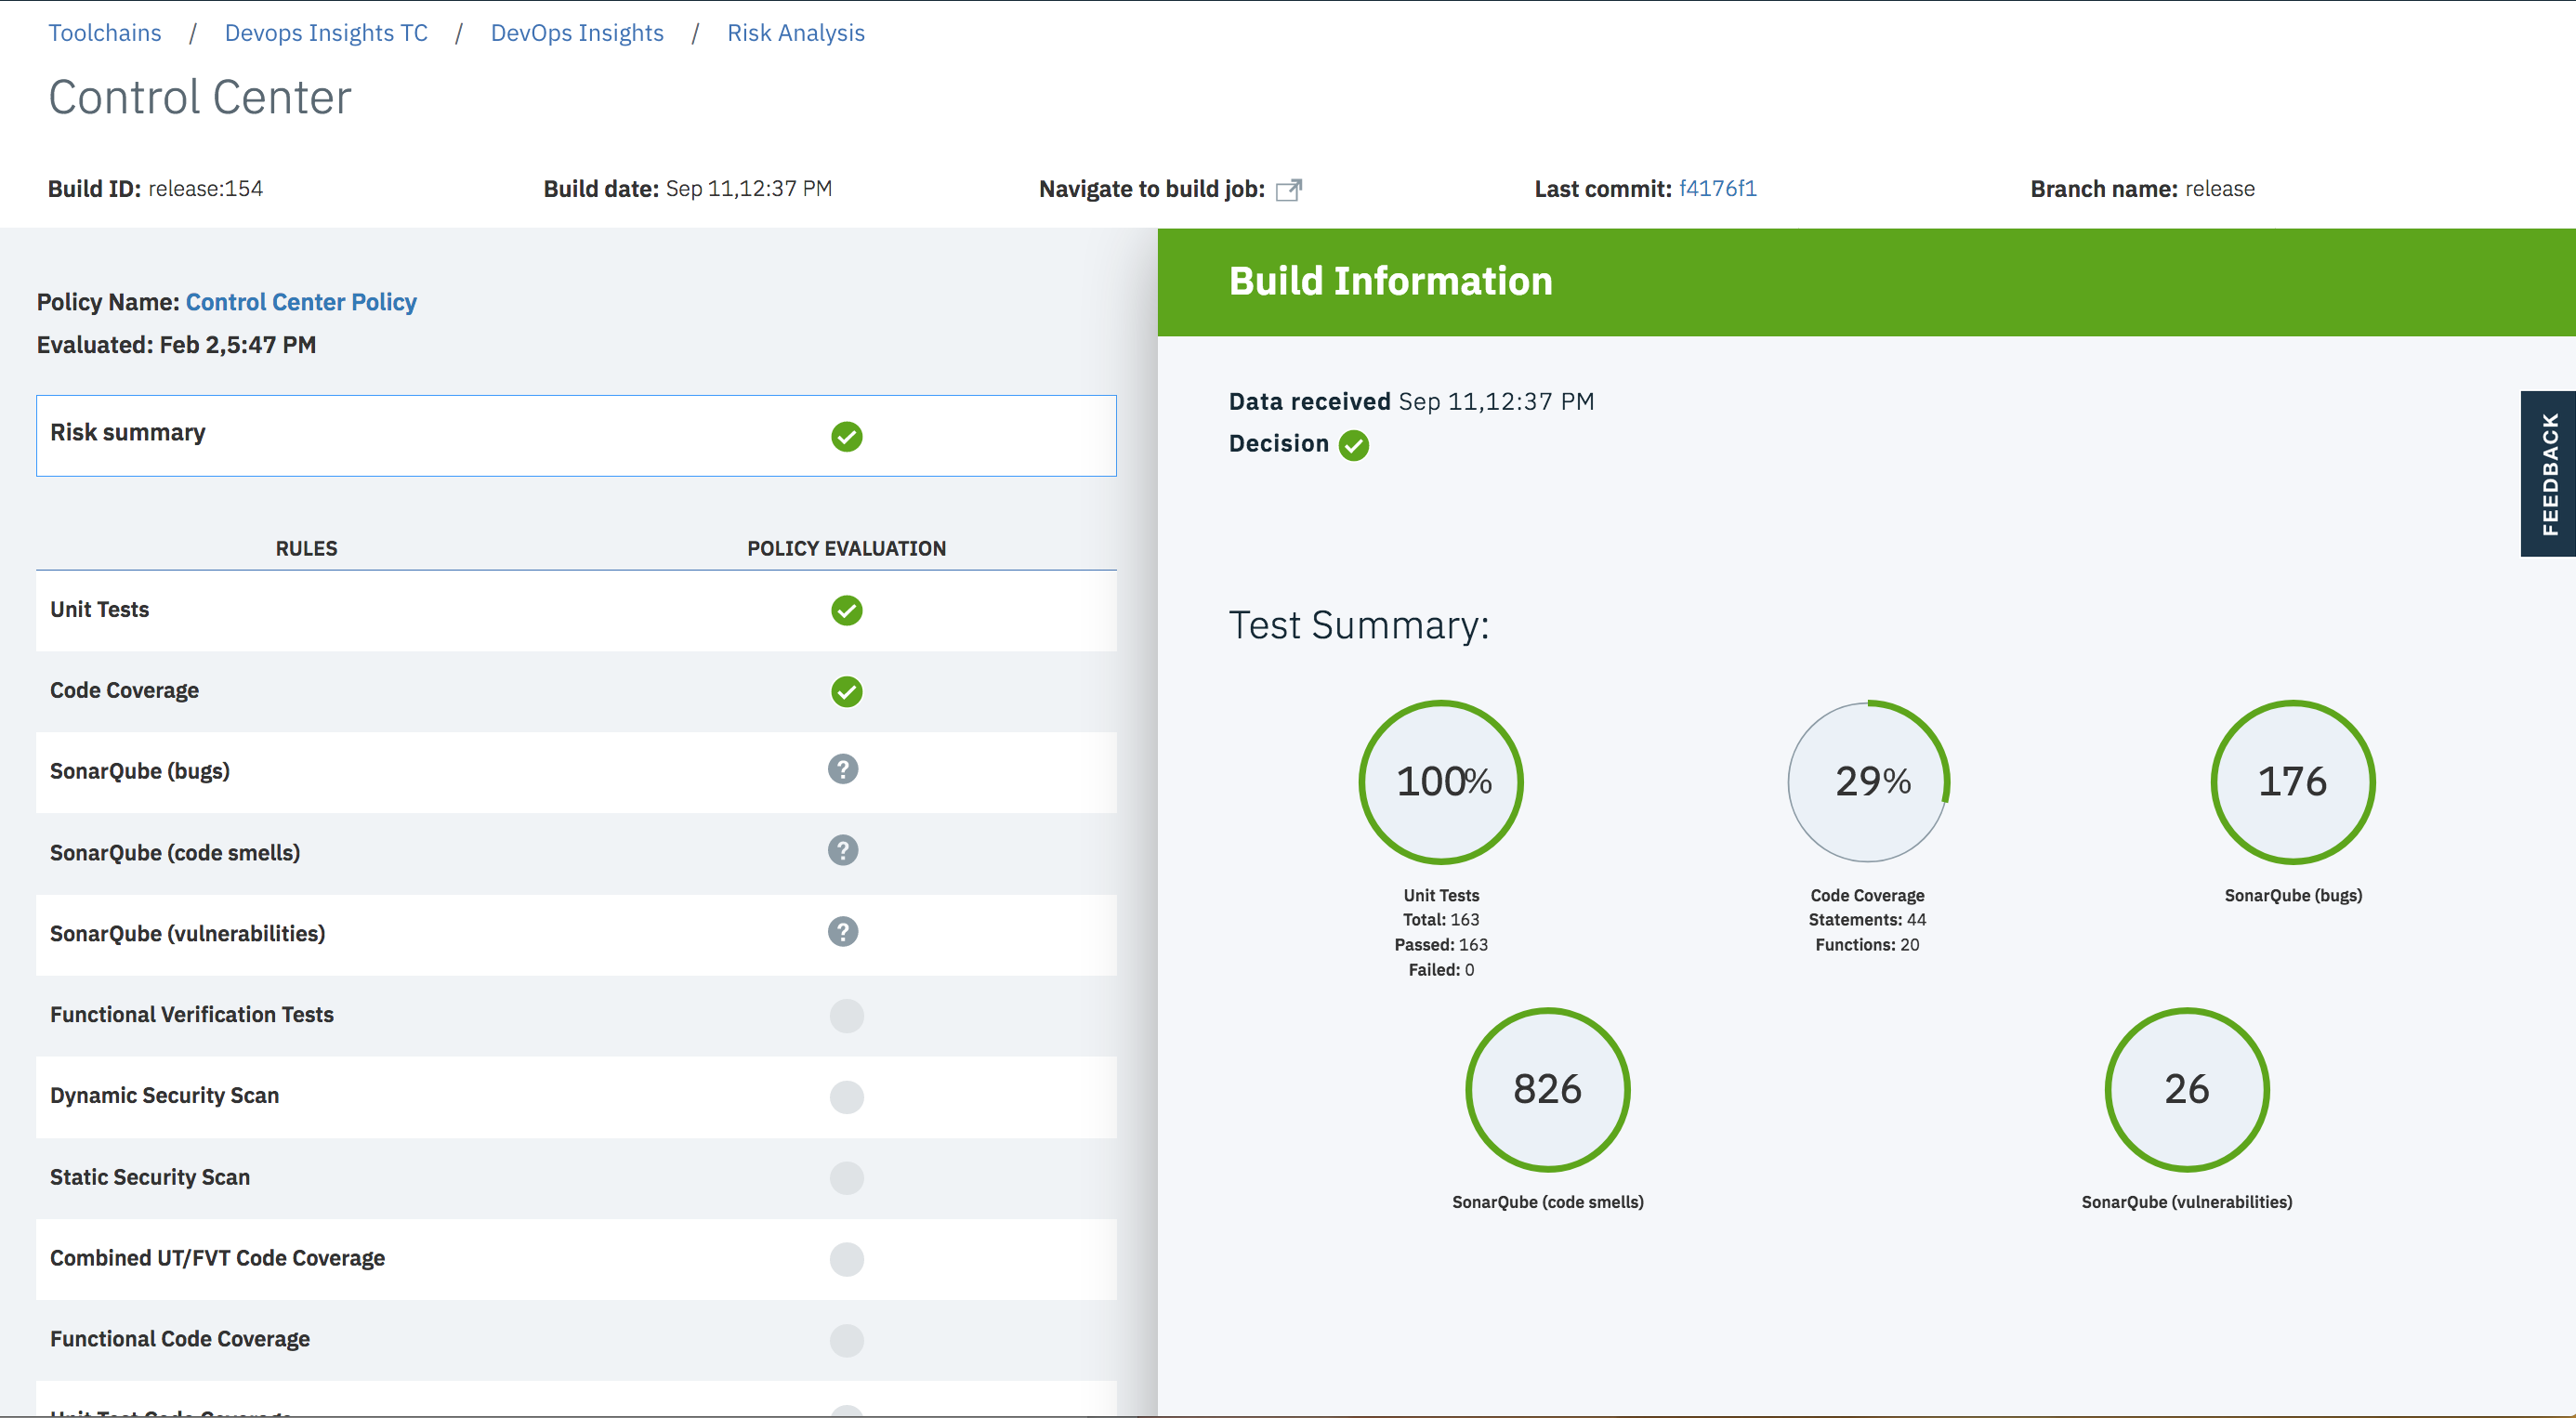
Here is a view that shows deployment risk details for a specific microservice and build. At the top, the UI provides information about last commit for the build and link to Jenkins for that specific build.
 {width="700"}
Then, the UI can show details of a specific test as well. In some cases, it will point to the original tool for details.
With this information on their fingertips, devops teams know which build is deployed in which environment, the quality of each build, link to commits and automated risk analysis based on the thresholds that an admin sets. All stakeholders can have access to this information to view how their development teams are performing.
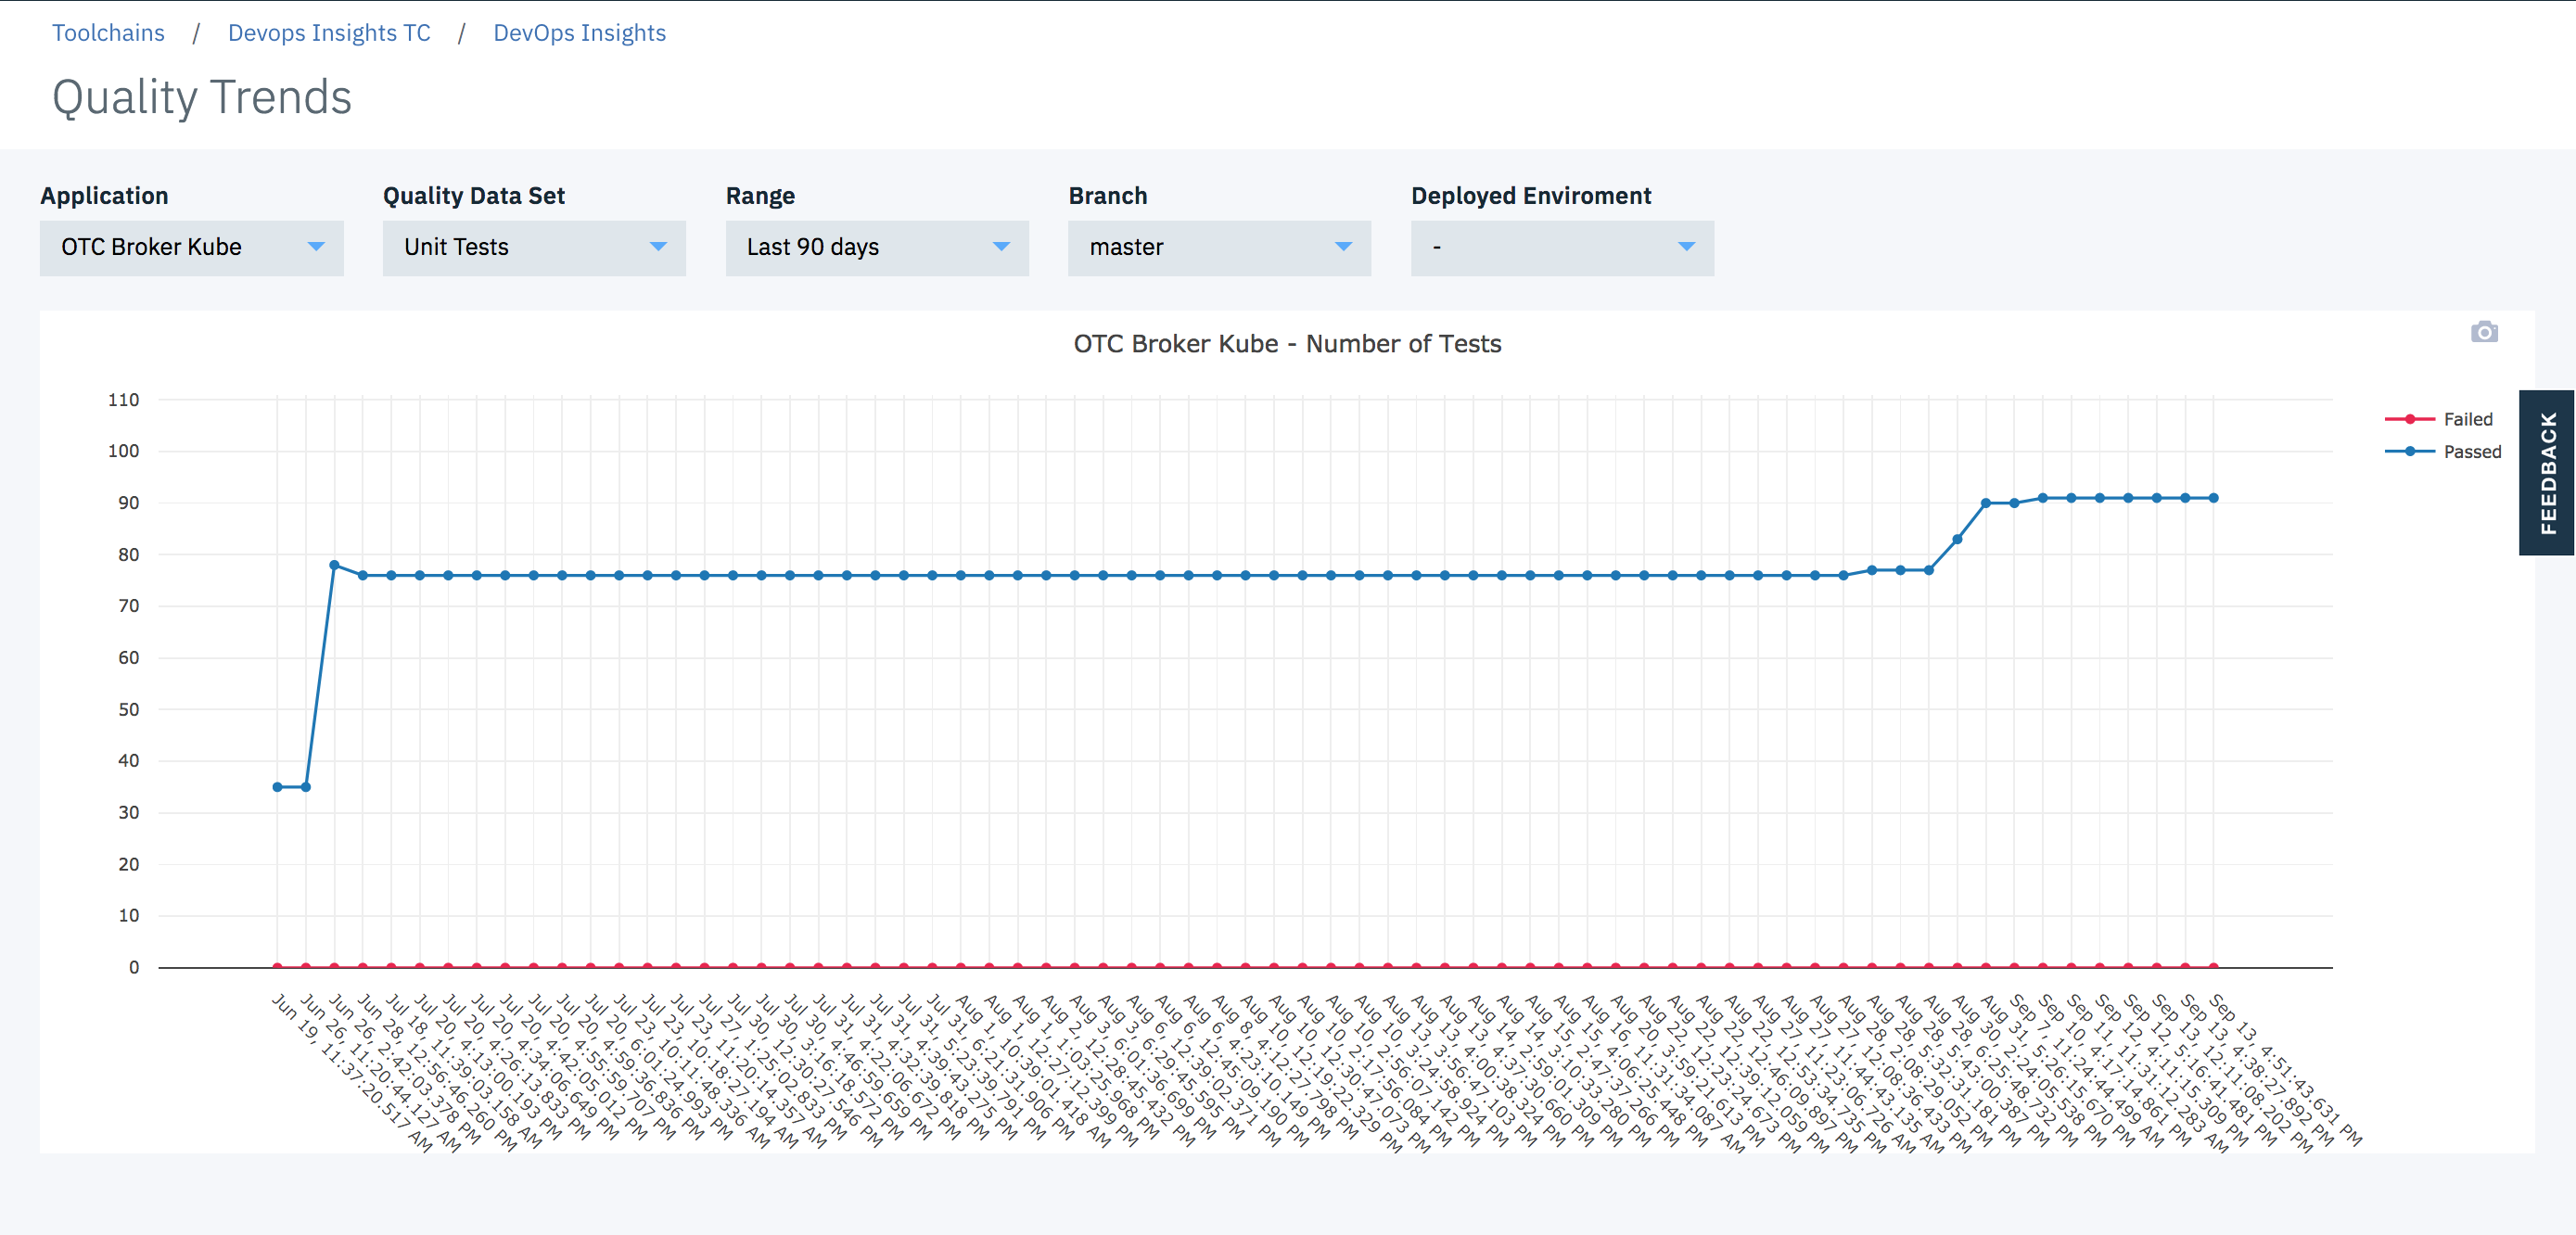
You can also view trends for unit test and functional verification tests for the builds that are from a certain branch or deployed to a certain environment. For example, you can see test trends for builds from the master branch. If some tests have been failing for builds that went to production, you may want to take some action. Also, if number of tests are dwindling over time, that may also be a cause for concern.
 {width="700"}
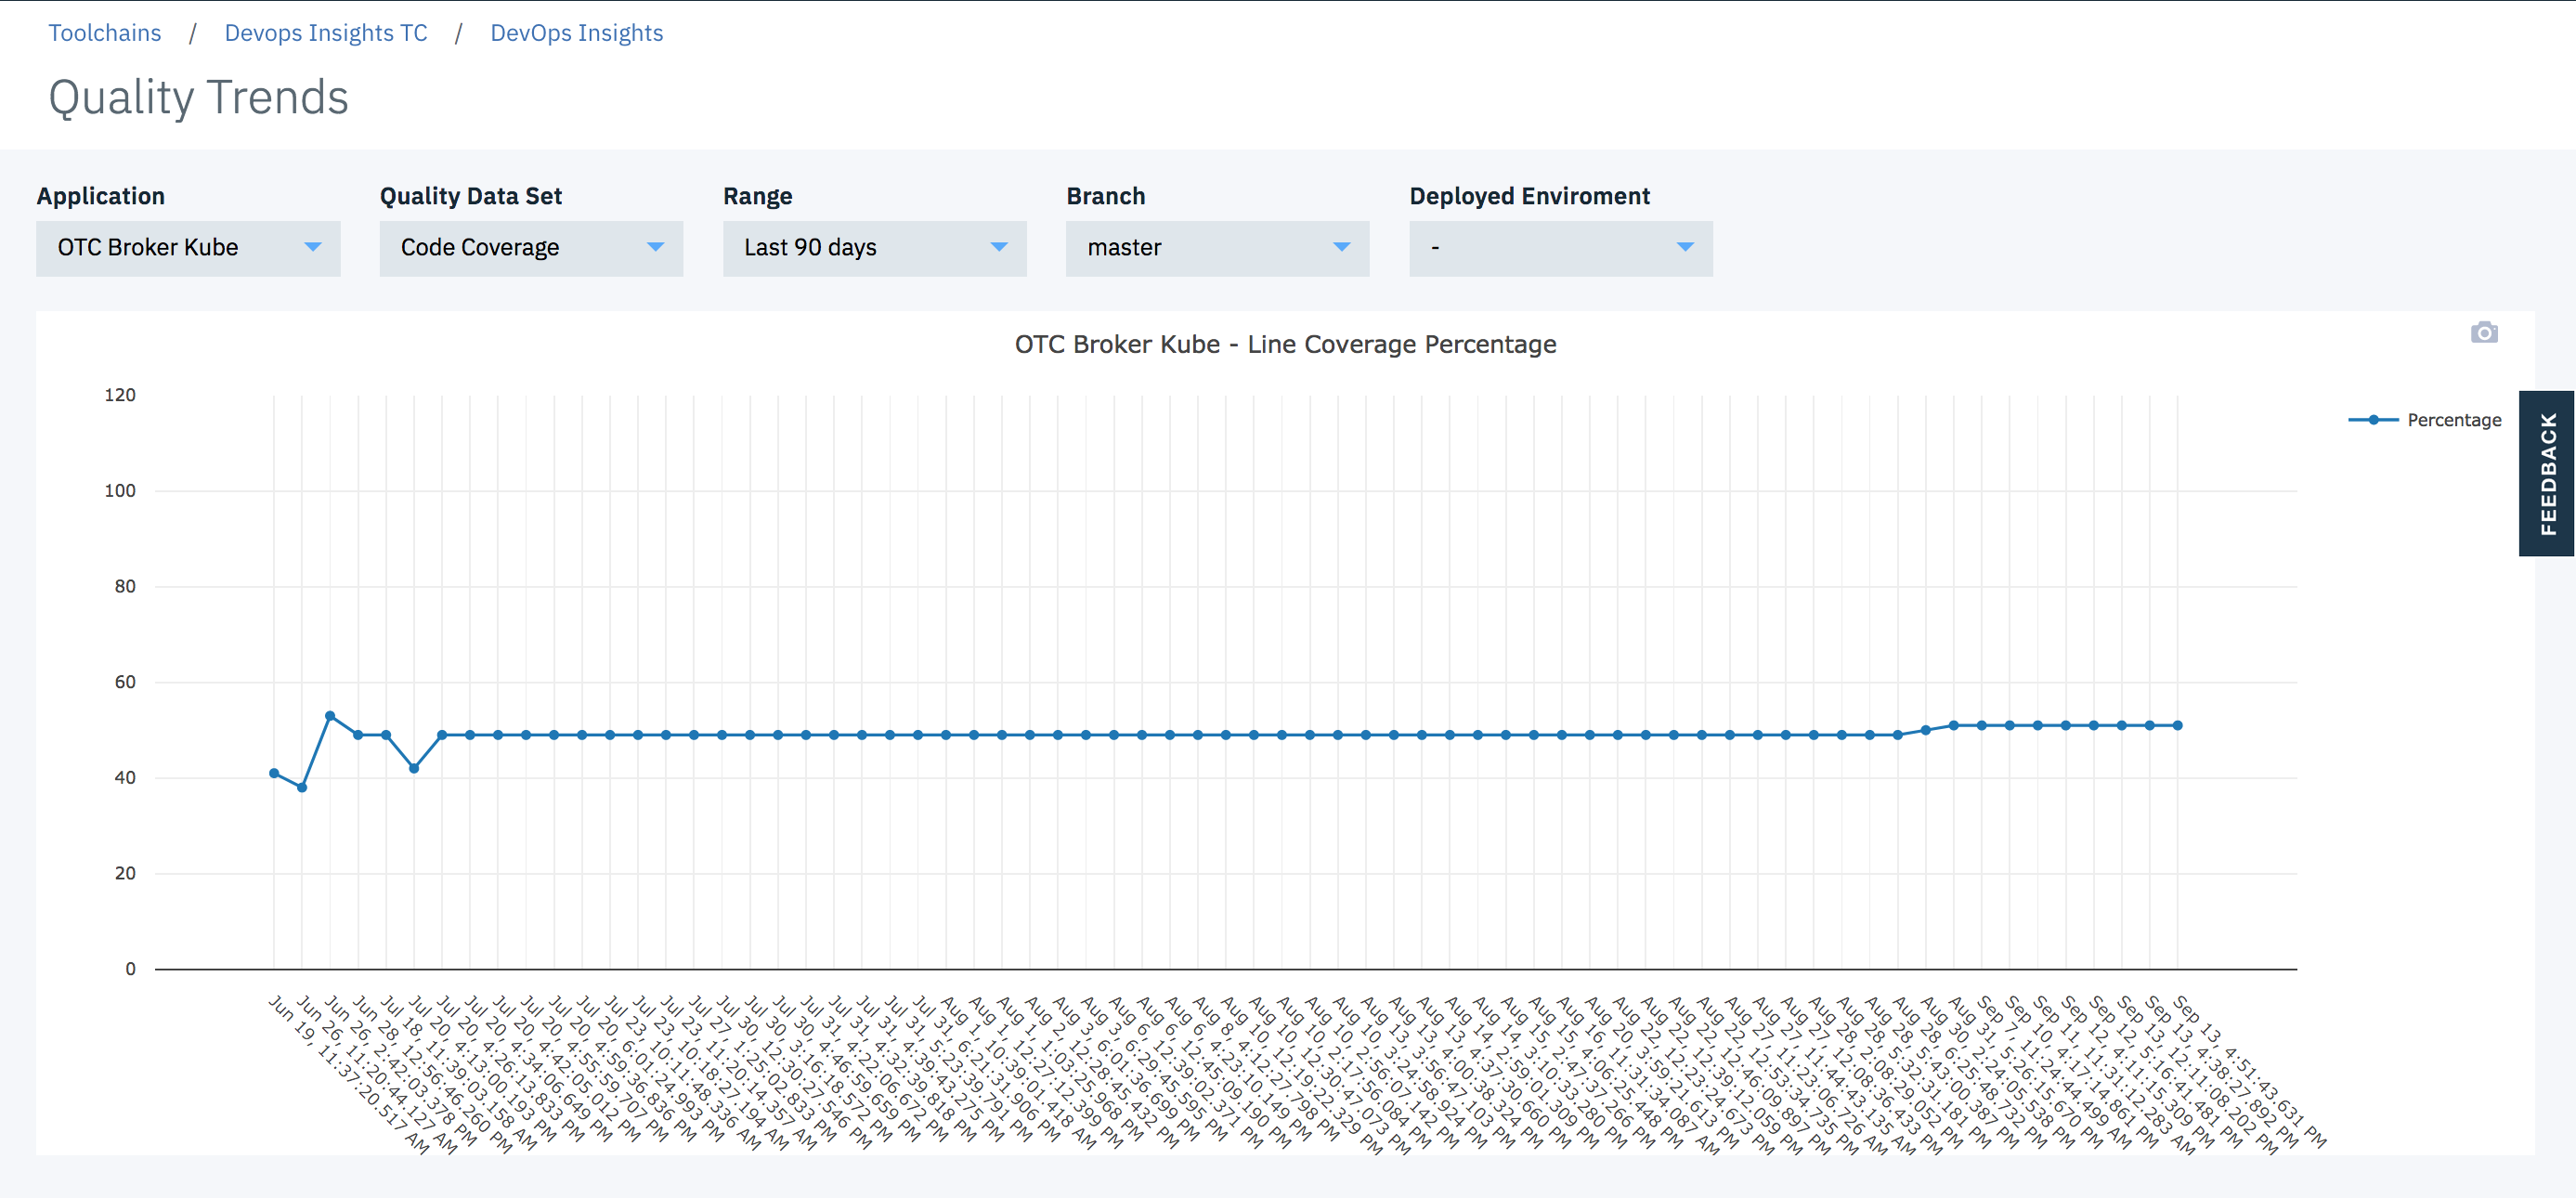
You can also view code coverage trends for the builds that are deployed to a certain environment. For example, you can see code coverage trends for builds that went to production. Ideally, you should see that code coverage improve over time for builds that went to production. If code coverage has been going down, you may want to take action.
 {width="700"}
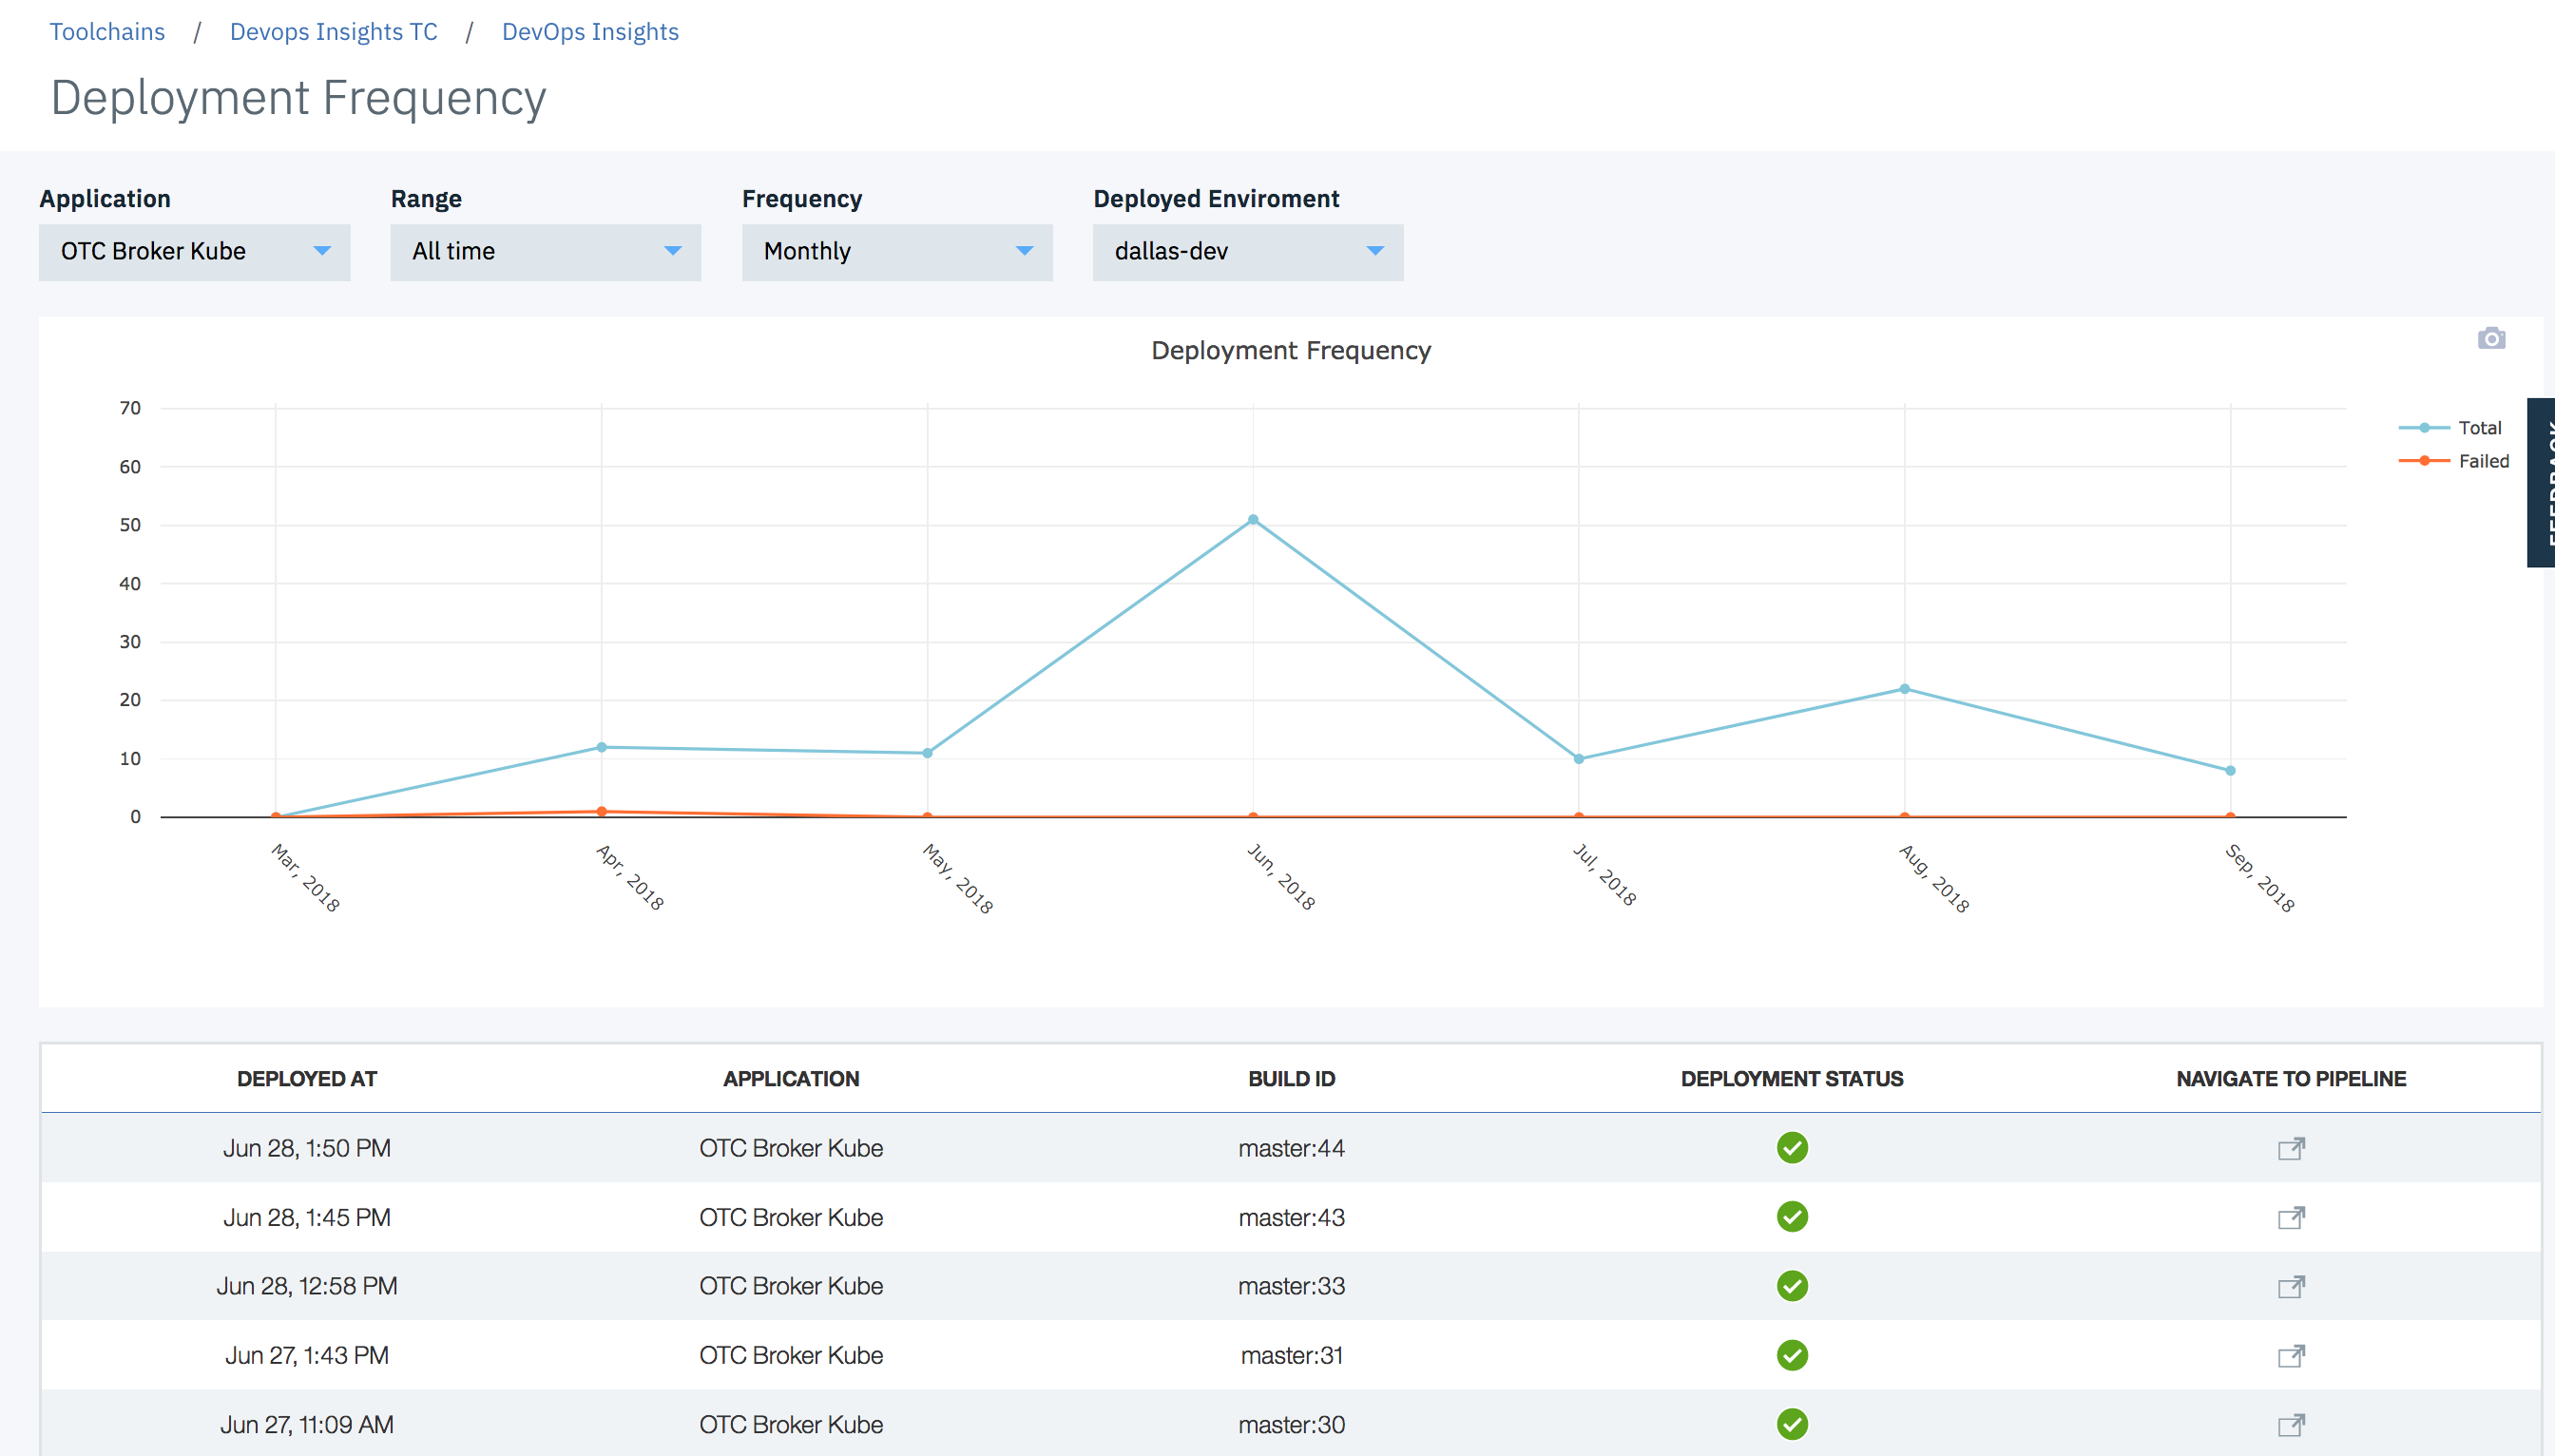
You can also view deployment frequency trends for your production, staging or other environments. This view also shows deployment success and failures. You can click on a point of interest and see deployment details. If yours is an agile team, you should see the deployment frequency trends go up.
 {width="700"}
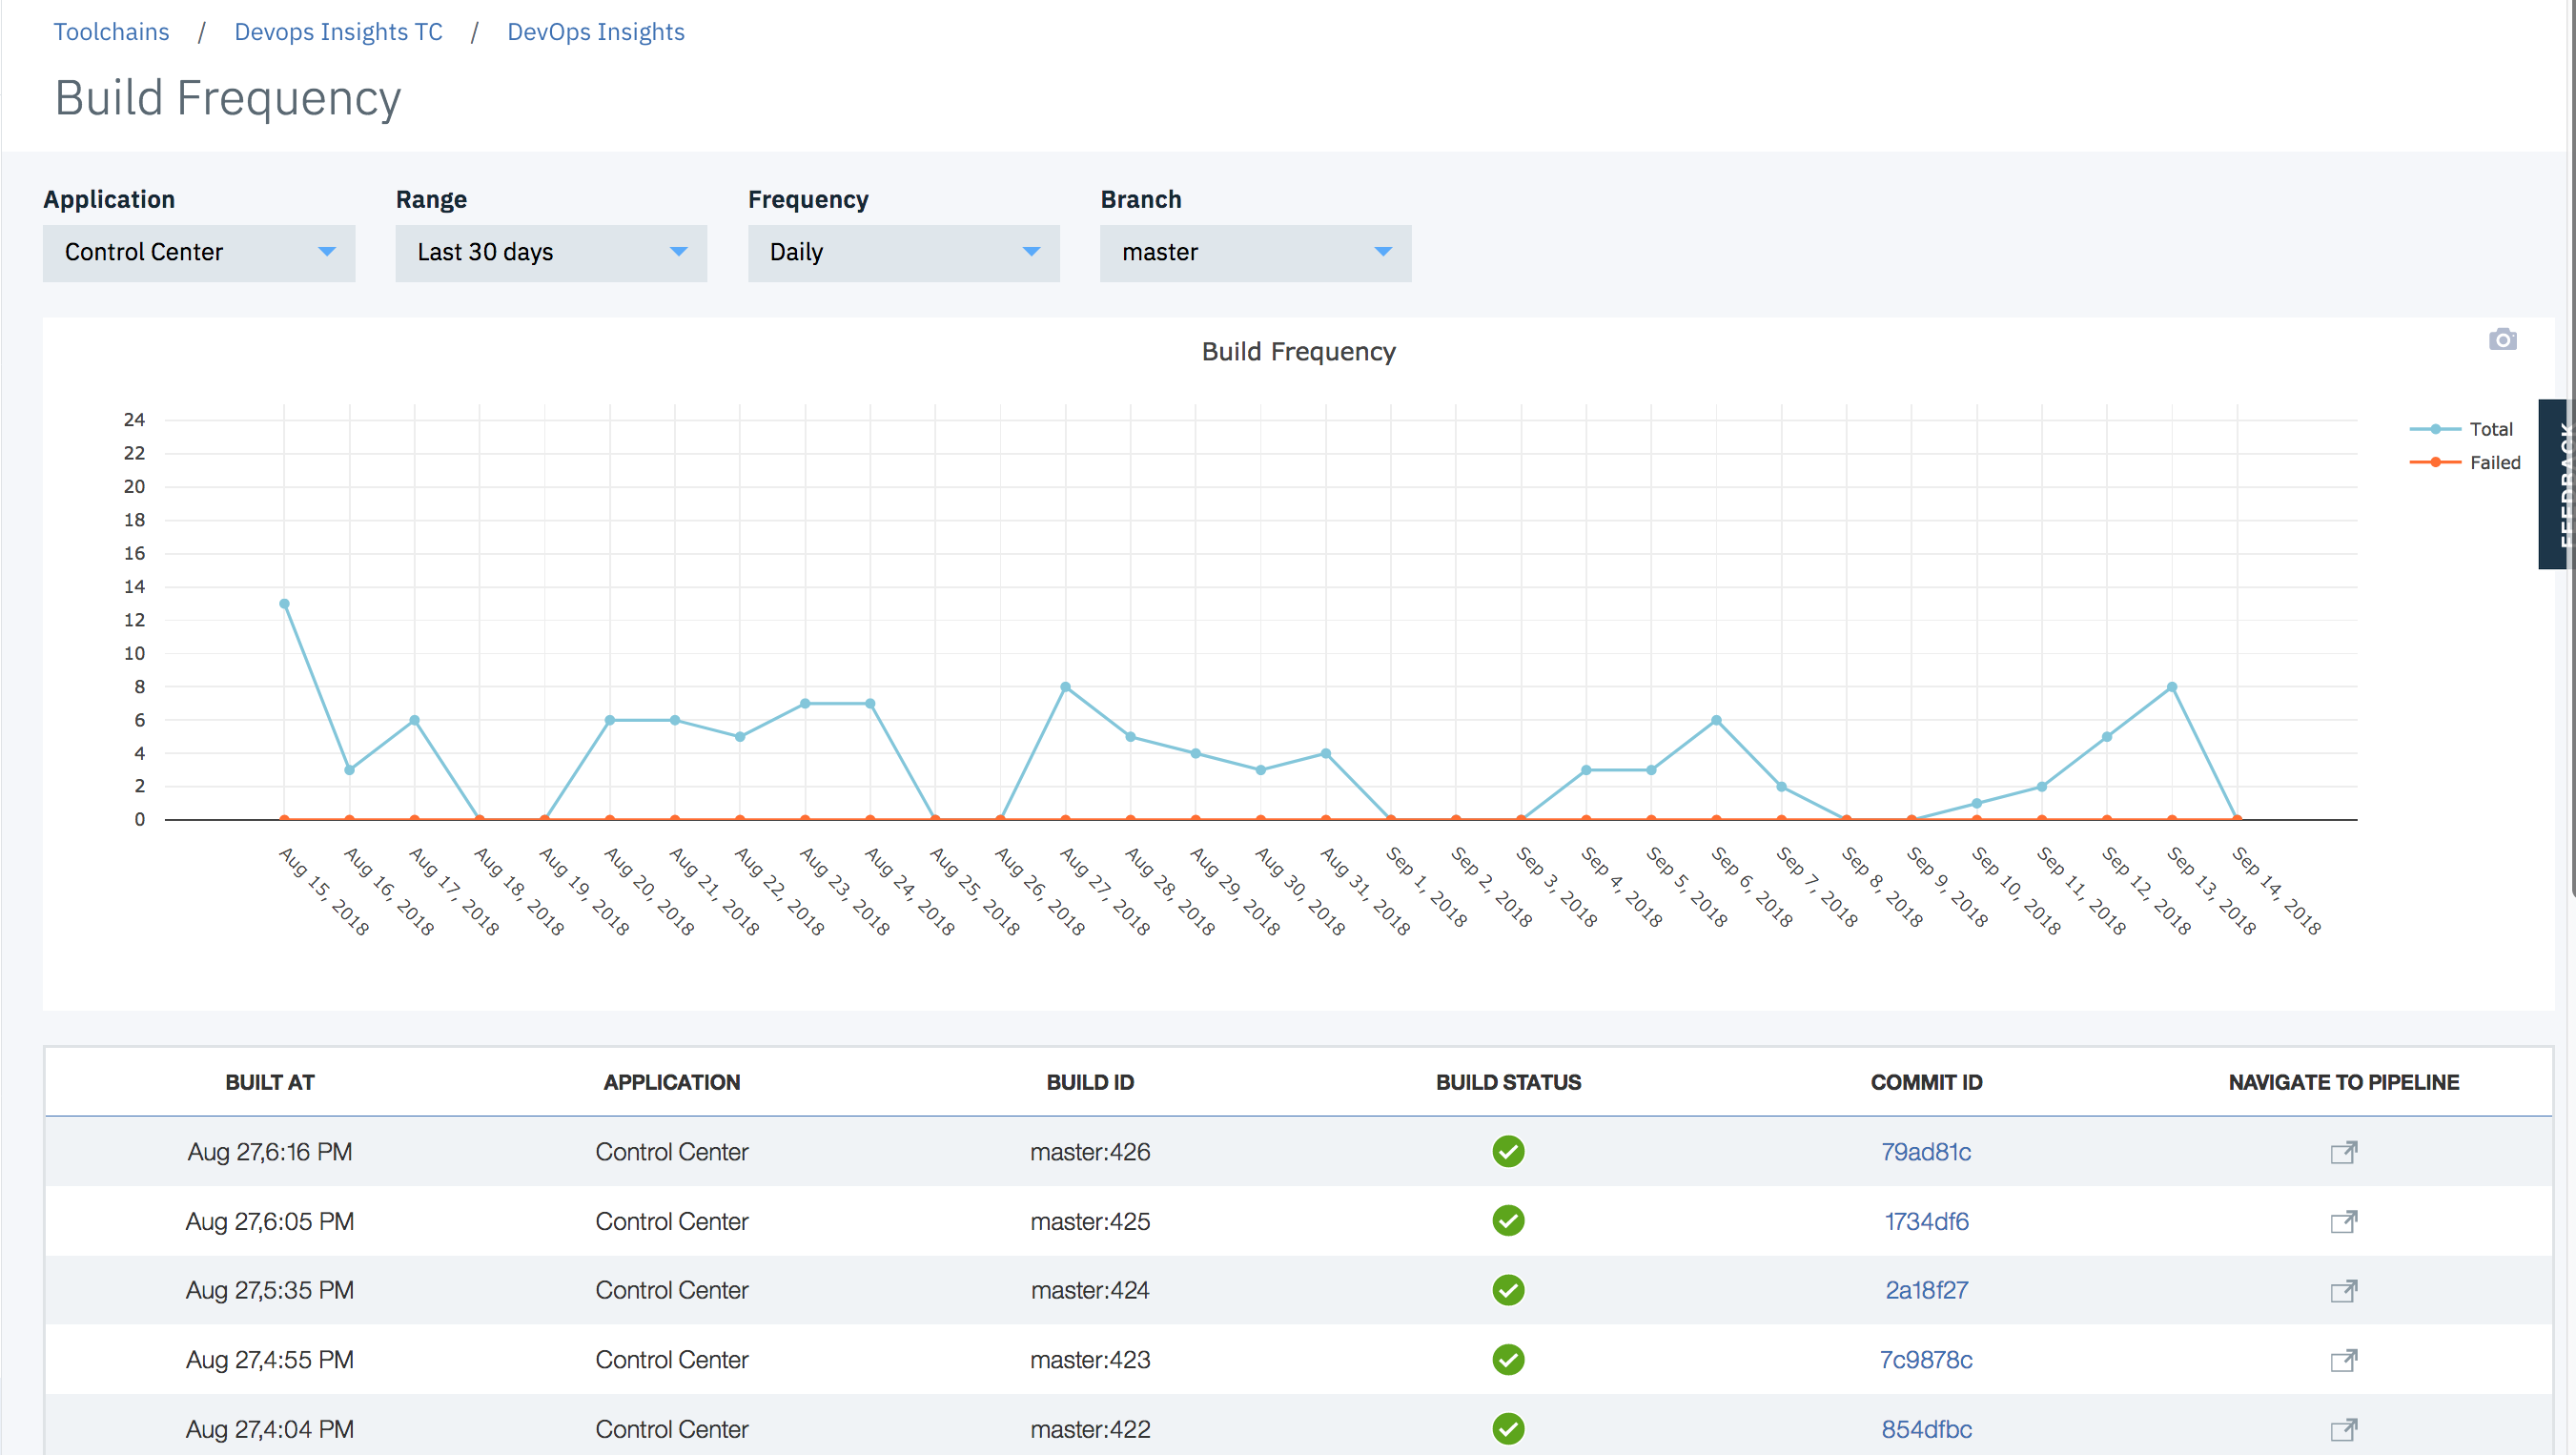
You can also view build frequency trends for your long running branches. This view also shows build success and failures. You can click on a point of interest and see build details. If yours is an agile team, you should see a lot of daily builds on the integration branch. Otherwise, your team is not merging their code frequently.
 {width="700"}
Supported Tools and Formats
We currently support the following test formats.
| Type | Formats |
|---|---|
| Unit Test | JUnit (json), xUnit (xml), Mocha (json), KarmaMocha (json) |
| Function Tests | JUnit (json), xUnit (xml), Mocha (json), KarmaMocha (json) |
| Code Coverage | Cobertura (xml), lcov, Istanbul (json), JaCoCo (xml) |
| Sonarqube | Sonarqube |
| Static Security Scan | IBM Application Security on Cloud (xml) |
| Dynamic Security Scan | IBM Application Security on Cloud (xml) |
| IBM Vulnerability Advisor | IBM Vulnerability Advisor (json) |
| Custom Data Sets - Tests | JUnit (json), xUnit (xml), Mocha (json), KarmaMocha (json) |
| Custom Data Sets - Code Coverage | Cobertura (xml), lcov, Istanbul (json), JaCoCo (xml) |
For golang gocov users, please convert to Cobertura using gocov XML(Cobertura) export
Connect with Us
For a demo and technical deep dive, please connect with Vijay Aggarwal via Linked In or via email.
Sample Pipelines and Code
Here are two complete pipeline examples defined as declarative Jenkinsfile and a scripted Jenkinsfile.
This git repo contains a sample nodejs application code and tests, as well as a Jenkinsfile, you can play with it by simply forking this repo and modifying the Jenkinsfile to replace all the placeholder with your actual information. (Note: if you don't have NodeJS installed in your Jenkins environment, you might have to install the node.js Jenkins plugin. If you do have NodeJS installed, you can comment out the "tools" section in the Jenkinsfile)
Prerequisites
At a high level, here are the integration steps. These steps are described later in this document.
- An IBM Cloud account. Create account
- A DevOps toolchain. Learn more about toolchains here.
- The Jenkins plugin. Install plugin
- DevOps Insights
Creating a toolchain
Before you can integrate DevOps Insights with a Jenkins project, you must create a toolchain and add the DevOps Insights and Jenkins tools to it.
First, create an empty toolchain that you can add tools to.
-
Go to the Create a Toolchain page.
-
Under Other Templates, click the Build your own toolchain template.
-
Name the toolchain and click Create.
Next, add the DevOps Insights and Jenkins tools to your toolchain.
-
On the toolchain's Overview page, click Add a tool.
-
Click the DevOps Insights tile, and then click Create Integration.
-
On the toolchain's Overview page, click Add a tool again.
-
Click the Jenkins tile.
-
Enter the name and URL for your existing Jenkins project.
-
Click **Create Integration. **
You now have a toolchain that lets use DevOps Insights with Jenkins.
Integrating Jenkins Pipeline with DevOps Insights
- Install this plugin using the plugin manager (https://plugins.jenkins.io/ibm-cloud-devops). This plugin supports both declarative or scripted formats. It also supports Jenkins jobs.
- Connect your application
Open the pipeline definition or script and add these environment variables
In the definition, add the following environment variables. These variables are required for the pipeline to integrate with DevOps Insights.
[TABLE]
Tip: See the Jenkins pipeline
documentation for
more information about the credentials command.
Tip: If you are using the the scripted pipeline format, set your
credentials with withCredentials and your environment
with withEnv instead of credentials and environment, which are
used in the example below. See the Jenkins
documentation for
more about withCredentials.
These environment variables and credentials are used by the IBM Cloud DevOps plugin to interact with DevOps Insights. Here is an example of setting them in the declarative pipeline format.
environment {
        IBM_CLOUD_DEVOPS_API_KEY = credentials('BM_API_KEY')
        IBM_CLOUD_DEVOPS_APP_NAME = 'Weather-App'
        IBM_CLOUD_DEVOPS_TOOLCHAIN_ID = '1111111-aaaa-2222-bbbb-333333333'
    }
Adding Cloud DevOps steps
The Cloud DevOps plugin adds four steps to Jenkins pipelines for you to use. Use these steps in your pipelines to interact with DevOps Insights.
publishBuildRecord, which publishes build information to DevOps InsightspublishTestResult, which publishes test results to DevOps InsightspublishDeployRecord, which publishes deployment records to DevOps InsightsevaluateGate, which enforces DevOps Insights policies
Add these steps to your pipeline definition wherever you need them to run. For example, you might upload test results after running a test, and then evaluate those results at a gate after they are uploaded.
Tip: by default, the version number is set to be {pipeline name}:{build number}, you can also set the custom version number in each step
Publishing build records
Publish build records with the publishBuildRecord step. This step
requires four parameters. It can also accept one optional parameter.
[TABLE]
Here are the parameters in an example command:
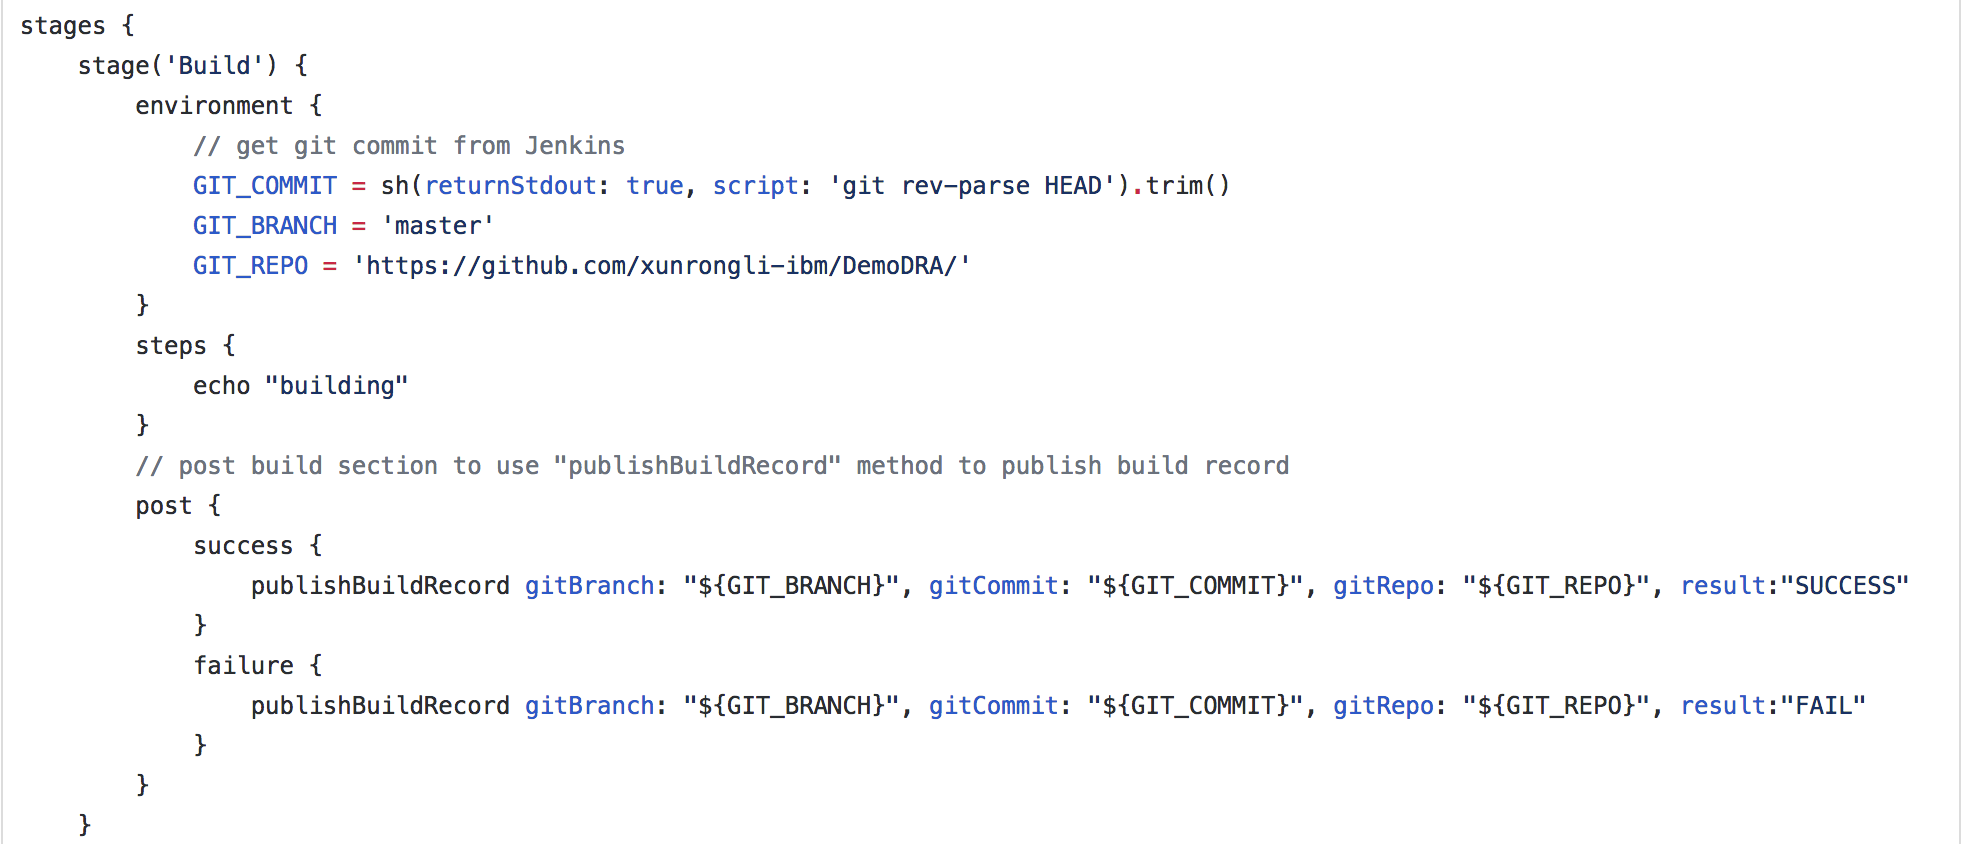 {width="700"}
Tip: Jenkins Pipeline does not expose Git information as environment
variables. You can get the Git commit ID by using the
command sh(returnStdout: true, script: 'git rev-parse HEAD').trim().
Publishing test results
Publish build records with the publishTestResult step. This step
requires two parameters. It can also accept one optional parameter.
[TABLE]
Here are the parameters in example commands. The first command publishes Mocha unit test results, and the second command publishes code coverage test results.
publishTestResult type:'unittest', fileLocation: './mochatest.json'
publishTestResult type:'code', fileLocation: './tests/coverage/reports/coverage-summary.json'
publishTestResult type:'fvt', fileLocation: './mochafvt.json', environment: 'STAGING'
publishTestResult type:'staticsecurityscan', fileLocation: './static-result.xml'
publishTestResult type:'dynamicsecurityscan', fileLocation: './dynamic-result.xml'
publishTestResult type:'vulnerabilityadvisor', fileLocation: './vulnerability-advisor.json'
Publishing SonarQube results
After you configure a SonarQube scanner and server by following the instructions in the SonarQube docs, you can publish scan results to DevOps Insights.
To configure your Jenkins Pipeline to accept these results, add the following three required parameters and one optional parameter to it:
[TABLE]
Here are the SonarQube parameters used in a sample stage:
stage ('SonarQube analysis') {
    steps {
        script {
            def scannerHome = tool 'Default SQ Scanner';
            withSonarQubeEnv('Default SQ Server') {

                env.SQ_HOST_URL = SONAR_HOST_URL;
                env.SQ_AUTHENTICATION_TOKEN = SONAR_AUTH_TOKEN;
                env.SQ_PROJECT_KEY = "My Project Key";

                run SonarQube scan ...
            }
        }
    }
}
stage ("SonarQube Quality Gate") {
     steps {
        ...
     }
     post {
        always {
            publishSQResults SQHostURL: "${SQ_HOST_URL}", SQAuthToken: "${SQ_AUTHENTICATION_TOKEN}", SQProjectKey:"${SQ_PROJECT_KEY}"
        }
     }
}
Publishing deployment records
Publish deployment records with the publishDeployRecord step. This
step requires two parameters. It can also accept two optional parameter.
[TABLE]
Here are the parameters in example commands. The first command publishes the deployment record for a staging environment; the second command publishes the deployment record for a production environment.
publishDeployRecord environment: "STAGING", appUrl: "http://staging-Weather-App.mybluemix.net", result:"SUCCESS"
publishDeployRecord environment: "PRODUCTION", appUrl: "http://Weather-App.mybluemix.net", result:"SUCCESS"
Adding gates
The first step is to define Gate Policies. Policies are sets of rules that control the gates in your delivery pipeline. If your code does not meet or exceed a policy that is enacted at a particular gate, the deployment is halted to prevent risky changes from being released.
You define policies in DevOps Insights, rather than in Jenkins.
To open the DevOps Insights Policies page:
- Open DevOps Insights and select Policies in the sidebar navigation.
- Select 'Create New Policy' and name your policy
- Add a rule. (*yes, the user will have to have data before they add a policy. It would be odd for them to add a policy on an application that has no test results. Plus, most users run tests for a while before adding a policy.)
- Connect the Insights Policy to Gates in your pipeline.
**
**
{width="700"}
{width="700"}
From here, you can define policies, add rules to them, and then add them
to gates in your Jenkins projects.
For more information, see Creating policies and
rules in
the Bluemix documentation.
Once policies have been created, add gates to your pipeline by using
the evaluateGate command. Gates enforce DevOps Insights policies,
which set test requirements for build promotion.
This step requires one parameters. It can also accept two optional parameter.
[TABLE]
Here are the parameters in an example command. In this command, the pipeline will continue running regardless of the gate's decision.
evaluateGate policy: 'Weather App Policy', forceDecision: 'true'
Communicating with toolchains
Send pipeline status to IBM Cloud DevOps toolchains by using
the notifyOTC command. To learn more about integrating Jenkins with
toolchains, see Notifying
toolchains
section below.
This step requires two parameters and can take an additional optional one.
| Parameter | Definition |
|---|---|
stageName |
The current pipeline stage's name. |
status |
The current pipeline stage's status. Using SUCCESS, FAILURE, or ABORTED will automatically trigger color highlighting in Slack. |
webhookUrl |
Optional: The webhook URL that is shown on your toolchain's Jenkins tile. If you include this parameter, its value overrides that of the IBM_CLOUD_DEVOPS_WEBHOOKURL environment variable. |
Here are examples of using the notifyOTC step in both declarative and
scripted pipeline definitions:
notifyOTC stageName: "Deploy", status: "SUCCESS"
Integrating with freeform Jenkins projects
Configuring Jenkins jobs for the Deployment Risk dashboard
After the plugin is installed, you can integrate DevOps Insights into your Jenkins project.
Follow these steps to use DevOps Insights gates and dashboard with your project.
-
Open the configuration of any jobs that you have, such as build, test, or deployment.
-
Add a post-build action for the corresponding type:
-
For build jobs, use Publish build information to IBM Cloud DevOps.
-
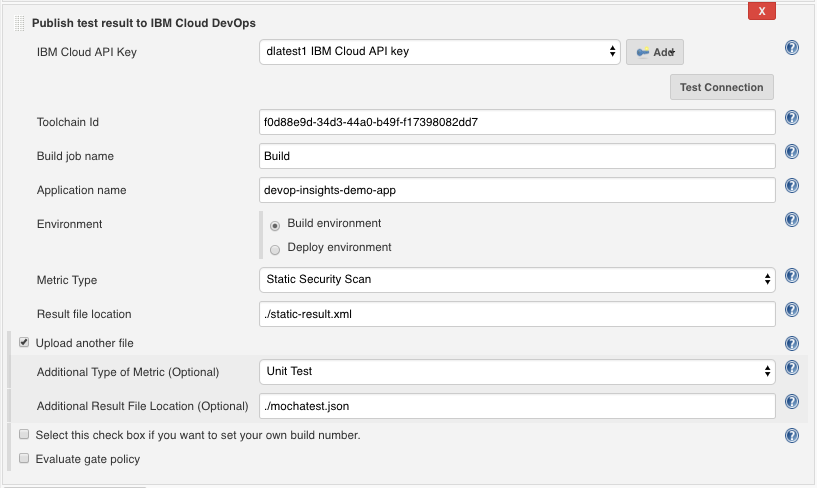
For test jobs, use Publish test result to IBM Cloud DevOps.
-
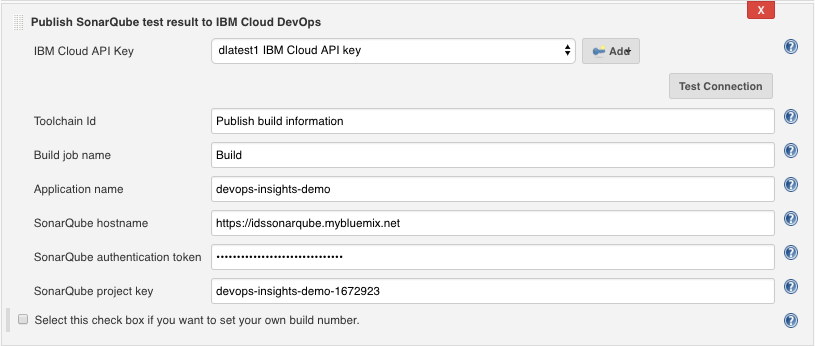
For SonarQube jobs, use Publish SonarQube test result to IBM Cloud DevOps.
-
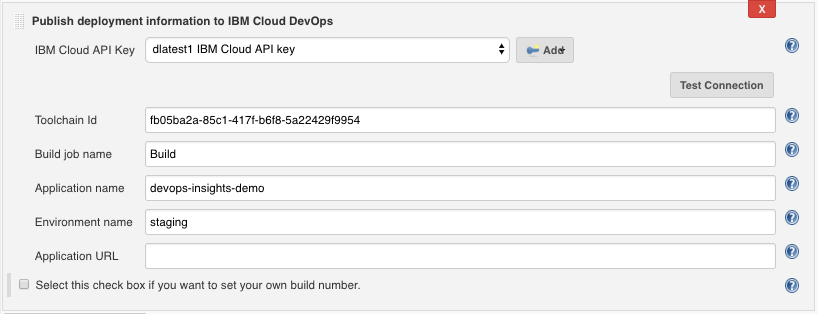
For deployment jobs, use Publish deployment information to IBM Cloud DevOps.
-
-
Complete the required fields. These will vary depending on job type.
-
From the Credentials list, select your IBM Cloud API key. If they are not saved in Jenkins, click Add to add and save them. You should use the "secret text" type to store your API key. Test your connection with Bluemix by clicking Test Connection.
-
In the Build Job Name field, specify your build job's name exactly as it is in Jenkins. If the build occurs with the test job, leave this field empty. If the build job occurs outside of Jenkins, select the Builds are being done outside of Jenkins check box and specify the build number and build URL.
-
For the environment, if the tests are running in build stage, select only the build environment. If the tests are running in the deployment stage, select the deploy environment and specify the environment name.
-
For the Result File Location field, specify the result file's location. If the test doesn't generate a result file, leave this field empty. The plugin uploads a default result file that is based on the status of current test job.
-
For the SonarQube hostname and SonarQube authentication token fields, specify the hostname and token that are configured on your SonarQube Server. For the SonarQube project key field, specify the project key of the SonarQube project that you wish to scan.
These images show example configurations:
 {width="550"}
Publish build information
 {width="550"}
 -
Publish test result
 {width="550"}
Publish SonarQube test result
 {width="550"}
Publish deployment information
**
**4. If you want to use DevOps Insights policy gates to control a
downstream deployment job, add a post-build action, IBM Cloud DevOps
Gate. Choose a policy and specify the scope of the test results. To
allow the policy gates to prevent downstream deployments, select
the Fail the build based on the policy rules check box. The
following image shows an example configuration:
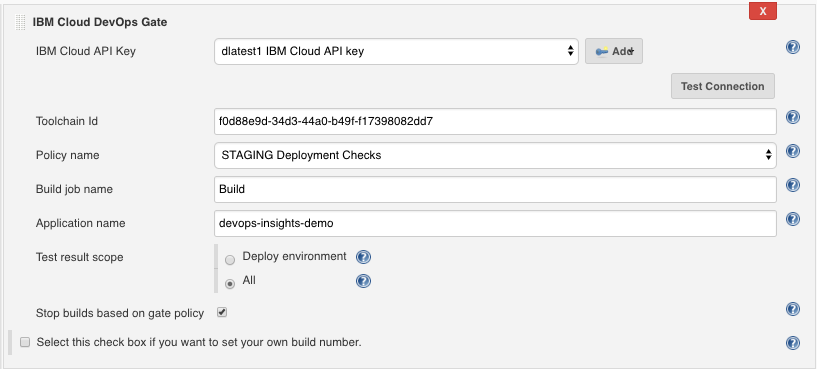 {width="550"}
5. Run your Jenkins Build job.
6. View the Risk Analysis dashboard by going to IBM Cloud DevOps, selecting your toolchain, and clicking DevOps Insights.
The Risk Analysis dashboard relies on the presence of a gate after a staging deployment job. If you want to use the dashboard, make sure that you have a gate after you deploy to the staging environment, but before you deploy to a production environment.
Notifying toolchains
You can configure your Jenkins jobs to send notifications to tools integrated to your toolchain (e.g., Slack, PagerDuty), and use traceability to track code deployments through tags, labels, and comments in your Git repository (repo).
Both Freestyle projects and Pipeline are supported.
Prerequisites
Create a toolchain
Refer to IBM Cloud documentation in order to create a tool chain that will integrate your Jenkins server to other tools such as Github, Insights, Slack and PagerDuty.
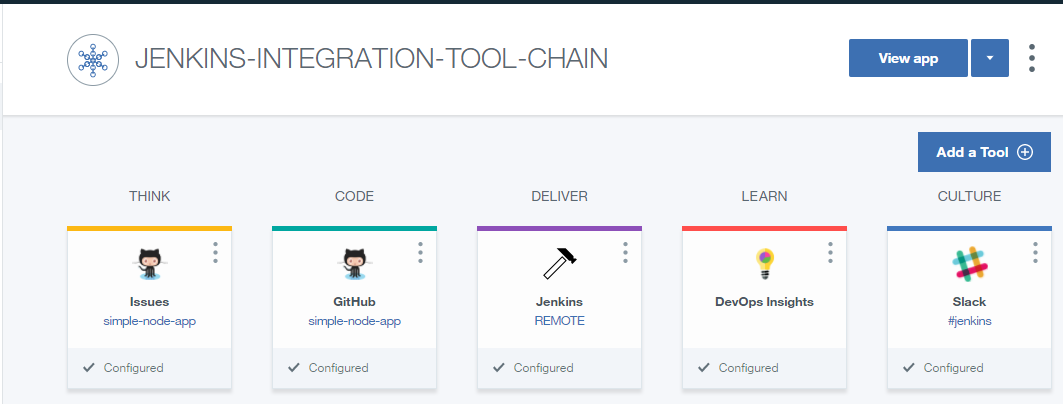 {width="500"}
- Slack integration is detailed in the IBM Cloud documentation.
- PagerDuty integration is detailed in the IBM Cloud documentation.
Jenkins Webhook URL
- On your tool chain main page, click the 3 dots in top right corner of the Jenkins tile, and select configure.
- Take note - copy / paste it in a notepad - of the Generated
toolchain webhook URL. Webhook URL uses a format like:
https://jenkins:c3cd97bc-b987-43bd-8020-c14bd1b1366a:8996de45-380a-40b2-a099-65a6eeb9a466@devops-api.ng.bluemix.net/v1/toolint/messaging/webhook/publish
Add bluemix credentials to Jenkins
This configuration step is common to both Freestyle or Pipeline projects.
- On the Manage Jenkins page, select Manage Credentials
- Scope: global
- Username: your IBM Cloud user id
- Password: corresponding password
- ID: IBM_CLOUD_DEVOPS_CREDS
- (optional) Description: IBM Cloud creds
- Save your changes
These credentials will be used in Freestyle or Pipeline jobs using the credentials ID.
Freestyle job
-
Create a new Freestyle project
-
Select "This project is parameterized".
-
Add the String following parameters:
Name Default Value IBM_CLOUD_DEVOPS_ORG the IBM Cloud org where your application is deployed IBM_CLOUD_DEVOPS_SPACE the IBM Cloud space where your application is deployed IBM_CLOUD_DEVOPS_APP_NAME the name of your application as deployed to IBM Cloud IBM_CLOUD_DEVOPS_WEBHOOK_URL the Jenkins webhook URLof your toolchain 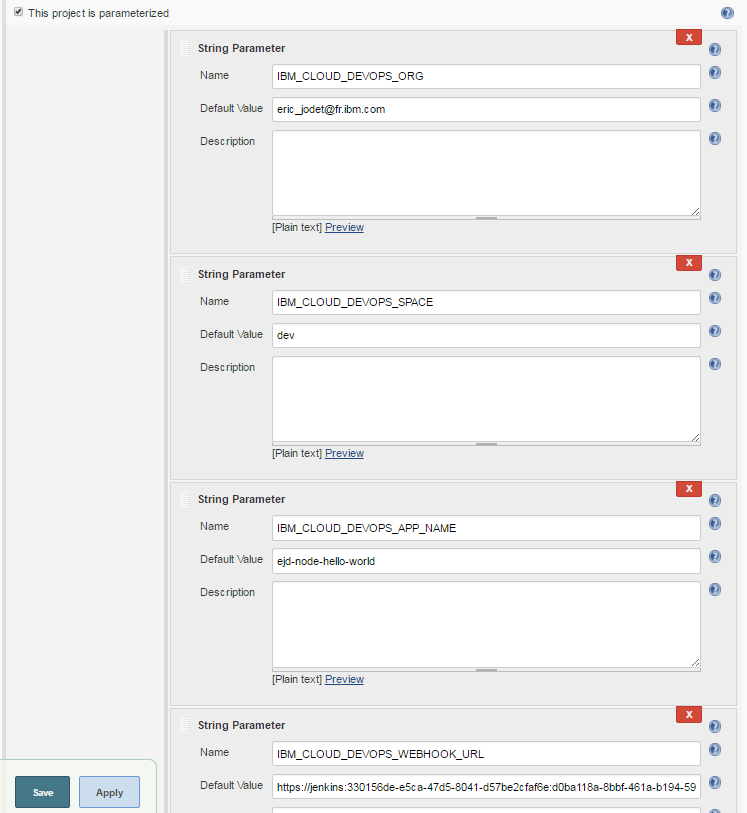
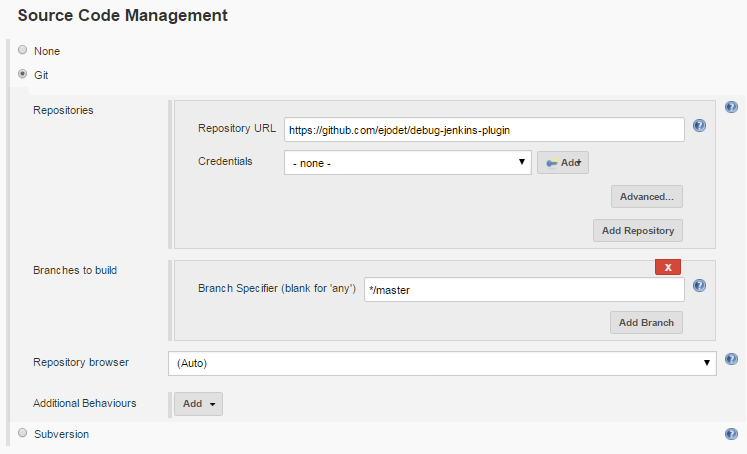
-
Source Code Management: select Git, and enter the URL and branch of the Git repository as configured in your toolchain.
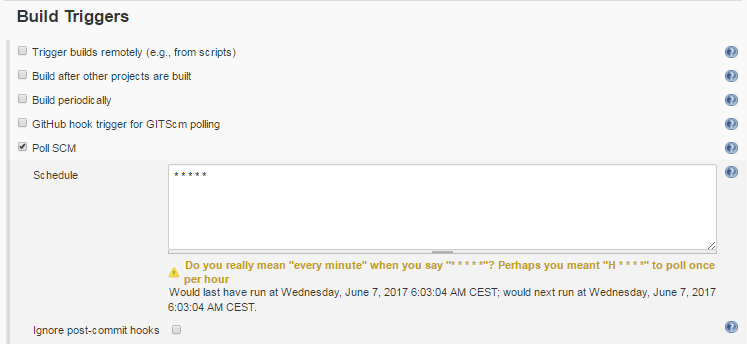
-
Build triggers: select Poll SCM in order to start job automatically after a Git commit. Enter your schedule options.
-
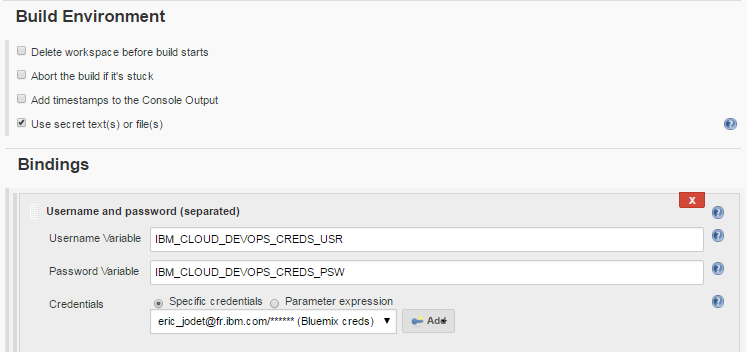
Build Environment
- Select Use secret text(s) or file(s)
- Add Username and password (separated)
- Username Variable: IBM_CLOUD_DEVOPS_CREDS_USR
- Password Variable: IBM_CLOUD_DEVOPS_CREDS_PSW
- Credentials: select the IBM Cloud specific credentials you added
to Jenkins server
-
Build step is not detailed here, as the script deploying your application to bluemix might be specific to your environment.
Below is a simple sample Shell script example that pushes your application to IBM Cloud.cf api https://api.ng.bluemix.net cf login -u $IBM_CLOUD_DEVOPS_CREDS_USR -p $IBM_CLOUD_DEVOPS_CREDS_PSW -o $IBM_CLOUD_DEVOPS_ORG -s $IBM_CLOUD_DEVOPS_SPACE cf push $IBM_CLOUD_DEVOPS_APP_NAME -n $IBM_CLOUD_DEVOPS_APP_NAME -
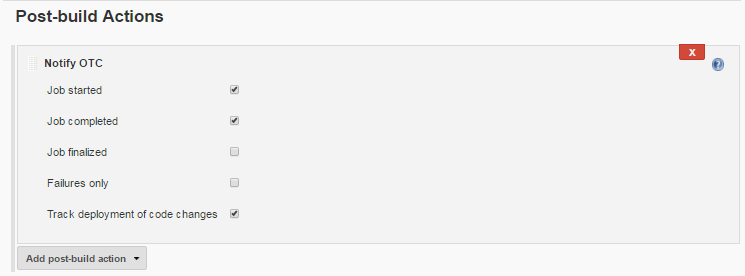
Post-build action: add the Notify OTC post-build action.
-
Select the options matching your needs:
- Notify Slack on Job started, completed or finalized events,
- Notify PagerDuty on Job faliures only
- Select Track deployment of code changes to enable traceability to
track code deployments through tags, labels, and comments in your
Git repository.
-
Save your changes.
-
You may test your Freestyle job by either:
-
Jenkins: select "Build with parameters" and launch a build.
-
Git: commit some changes and wait for SCM polling (if enabled) to pick up the changes and launch a build.
-
Pipeline
- Create a new Pipeline.
- Deployment script is not detailed here. To use IBM Cloud DevOps with the Jenkins pipeline project, you can follow the declarative and scripted examples
Publish the status of your pipeline stages to your Bluemix Toolchain
Configure your Jenkins pipelines to send notifications to tools integrated to your IBM Cloud Toolchain (e.g. Slack, PagerDuty).
-
Ensure you added the 5 required environment variables to your script, as detailed here.
environment { IBM_CLOUD_DEVOPS_CREDS = credentials('IBM_CLOUD_DEVOPS_CREDS') IBM_CLOUD_DEVOPS_ORG = 'dlatest' IBM_CLOUD_DEVOPS_APP_NAME = 'Weather-V1' IBM_CLOUD_DEVOPS_TOOLCHAIN_ID = '1320cec1-daaa-4b63-bf06-7001364865d2' IBM_CLOUD_DEVOPS_WEBHOOK_URL = 'https://jenkins:5a55555a-a555-5555-5555-a555aa55a555:55555555-5555-5555-5555-555555555555@devops-api.ng.bluemix.net/v1/toolint/messaging/webhook/publish' } -
Use the **notifyOTC **command
-
(required) stageName - the name of the current pipeline stage.
-
(required) status - the completion status of the current pipeline stage. ('SUCCESS', 'FAILURE', and 'ABORTED' will be augmented with color)
-
(optional) webhookUrl - the webhook obtained from the Jenkins card on your toolchain.
-
Declarative Pipeline Example:
stage('Deploy') {
    steps {
      ...
    }
    post {
        success {
            notifyOTC stageName: "Deploy", status: "SUCCESS"
        }
        failure {
            notifyOTC stageName: "Deploy", status: "FAILURE"
        }
    }
}
Track deployment of code changes
Configure your Jenkins pipelines to send deployable mapping messages to
your IBM Cloud toolchain,
to track code deployments through tags, labels, and comments in your Git
repository.
Use this notification only for status 'SUCCESS'. Any other status will be discarded.
-
Add a new environment variable to your script:
IBM_CLOUD_DEVOPS_SPACE: the IBM Cloud space where your application is deployedenvironment { IBM_CLOUD_DEVOPS_CREDS = credentials('IBM_CLOUD_DEVOPS_CREDS') IBM_CLOUD_DEVOPS_ORG = 'dlatest' IBM_CLOUD_DEVOPS_SPACE= 'production' IBM_CLOUD_DEVOPS_APP_NAME = 'Weather-V1' IBM_CLOUD_DEVOPS_TOOLCHAIN_ID = '1320cec1-daaa-4b63-bf06-7001364865d2' IBM_CLOUD_DEVOPS_WEBHOOK_URL = 'https://jenkins:5a55555a-a555-5555-5555-a555aa55a555:55555555-5555-5555-5555-555555555555@devops-api.ng.bluemix.net/v1/toolint/messaging/webhook/publish' } -
Use the **sendDeployableMessage **command
-
(required) status - the completion status of the current pipeline stage: 'SUCCESS'
-
(optional) webhookUrl - the webhook obtained from the Jenkins card on your toolchain.
-
Declarative Pipeline Example:
stage('Deploy') {
    steps {
      ...
    }
    post {
        success {
            notifyOTC stageName: "Deploy", status: "SUCCESS"
            sendDeployableMessage status: "SUCCESS"
        }
        failure {
            notifyOTC stageName: "Deploy", status: "FAILURE"
        }
    }
}
Change Log
Version 1.0 (May 16th, 2017)
- First release.
Version 1.0.1 (May 17th, 2017)
- Updated description.
Version 1.0.2 (May 25th, 2017)
- Fixed URL encoding issue
Version 1.0.3 (June 2nd, 2017)
- Fixed URL encoding issue for policy dropdown list
- Minor text fix in error message
Version 1.1.0 (June 08, 2017)
- Added Notifying toolchains section
Version 1.1.2 (July 17, 2017)
- Support custom build number
Version 1.1.3 (July 19, 2017)
- Change minimum required Jenkins version
Version 1.1.4 (July 24, 2017)
- Change environment settings to be one single global configuration for all steps
Version 1.1.5 (July 28, 2017)
- Throw warnings instead of errors when fails to get Jenkins root url
Version 1.1.6 (Aug 10, 2017)
- Show missing required environment variables in error logs
- Fix upload SonarQube result
Version 1.1.7 (Sep 6, 2017)
- Support log in using Bluemix API Key in the pipeline
- Support lcov format for code coverage results
Version 1.1.8 (Sep 13, 2017)
- Support environment variables for application name, org name in freestyle jobs
Version 1.1.10 (Sep 19, 2017)
- fix bug on uploading SonarQube result
Version 1.1.11 (Sep 29, 2017)
- Support Non-ASCII characters as Jenkins job name
Version 1.1.12 (Oct 19, 2017)
- Support upload security scan results
Version 1.1.13 (Nov 3, 2017)
- Adapt to the global console changes
Version 1.1.14 (Jan 12, 2018)
- Support custom quality data type
Version 1.1.15 (Jan 18, 2018)
- Support uploading large SonarQube data
Version 1.1.16 (Jan 23, 2018)
- Log errors such as the project key isn't found when publishing SonarQube results
Version 1.1.17 (Jan 30, 2018)
- handle the case when publishing SonarQube issues are over 10k limit
Version 1.1.18 (Feb 22, 2018)
- enhance error handling for publishing SonarQube issues
Version 2.0.1 (Jun 21, 2018)
- Add the support to IAM tokens
- Remove the dependencies on the organization name and OTC
- Minor bugs fixed and error messages enhance
Version 2.0.2 (Aug 15, 2018)
- Add the support to multiple regions
- Better error message
Version 2.0.3 (Sep 17, 2018)
- Fix the policy link
Version 2.0.4 (Sep 27, 2018)
- Add the option to enable debug log
Version 2.0.5 (Nov 15, 2018)
- Fix policy dropdown for the freestyle job
- Support custom data set for the freestyle job
Version 2.0.6 (Nov 20, 2018)
- Fix output urls
Version 2.0.7 (Mar 12, 2019)
- Added appName parameter to all the commands
Version 2.0.9 (Mar 18, 2019)
- Changed appName parameter applicationName parameter for all the commands. The environment variable IBM_CLOUD_DEVOPS_APP_NAME will be ignored if this parameter is set for any step job.
Version 2.0.12 (Sep 18, 2019)
-
Changed Internal urls domain from bluemix.net to cloud.ibm.com