Generic reusable plugin that will show a chart in column based on properties file.
The plugin reads properties file in your archive, specified by glob, and use one value, defined by key, to draw a chart for both project and view. The plugin was originally designed to show results of benchmarks, but can be misused for anything key-number what desire chart. Eg total and failed tests summaries, watching over size of package and so on. The graph is scaled, so you will never miss smallest change.
- Properties file
- Pipelines
- Project summary
- View summary
- Changing build result
- Denylist and Allowlist
- Project Settings
- View Settings
- Limitations
- Future work
To make plugin work, you need a properties file with results form your job, archived. The properties file is eg.:
lastSuccessfulBuild/artifact/jbb-report/result/specjbb2015-C-20180717-00001/report-00001/specjbb2015-C-20180717-00001.raw
# garbage
jbb2015.result.metric.max-jOPS = 22523
jbb2015.result.metric.critical-jOPS = 8902
jbb2015.result.SLA-10000-jOPS = 4774
jbb2015.result.SLA-25000-jOPS = 7442
jbb2015.result.SLA-50000-jOPS = 9643
jbb2015.result.SLA-75000-jOPS = 11833
jbb2015.result.SLA-100000-jOPS = 13791
other garbage
The parser is quite forgiving, and will skip garabge. Supports both : and = delimiters.
      stage('charts1') {
        steps {
         genericChartPublisher(charts: [
[chartColor: '#AABBCC', fileNameGlob: 'file.props', key: 'a', limit: 10, resultAllowList: '', resultDenyList: '', title: 'a', unstableCondition: ' L0 <= 10'],
[chartColor: '#FF6384', fileNameGlob: 'anotherOrSamefile.props', key: 'b', limit: 10, resultAllowList: '', resultDenyList: '', title: 'b']])

        }
    }
Hugest graphs are shown in project summary. You can have as much graphs as you wish, and have detailed tool-tip: 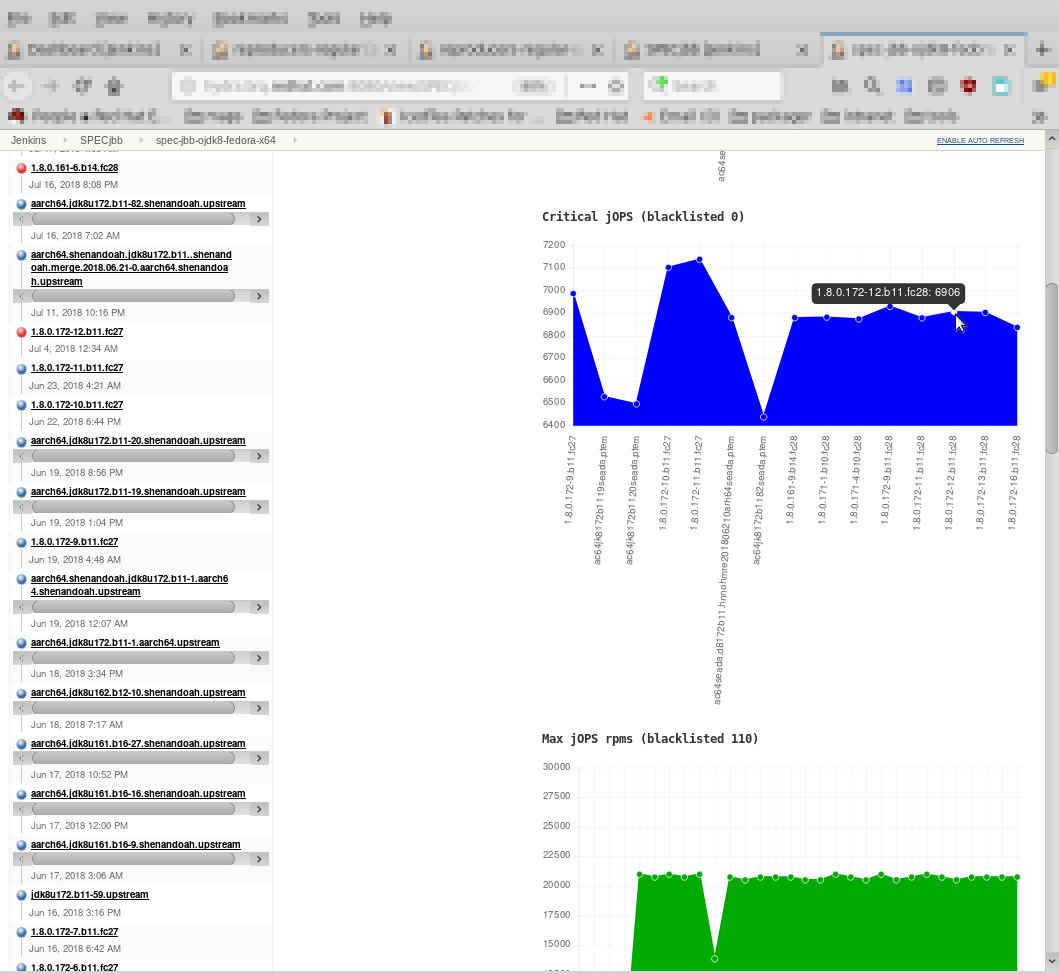 Comparing individual jobs was never more simple:)
You can include the graphs to the view: 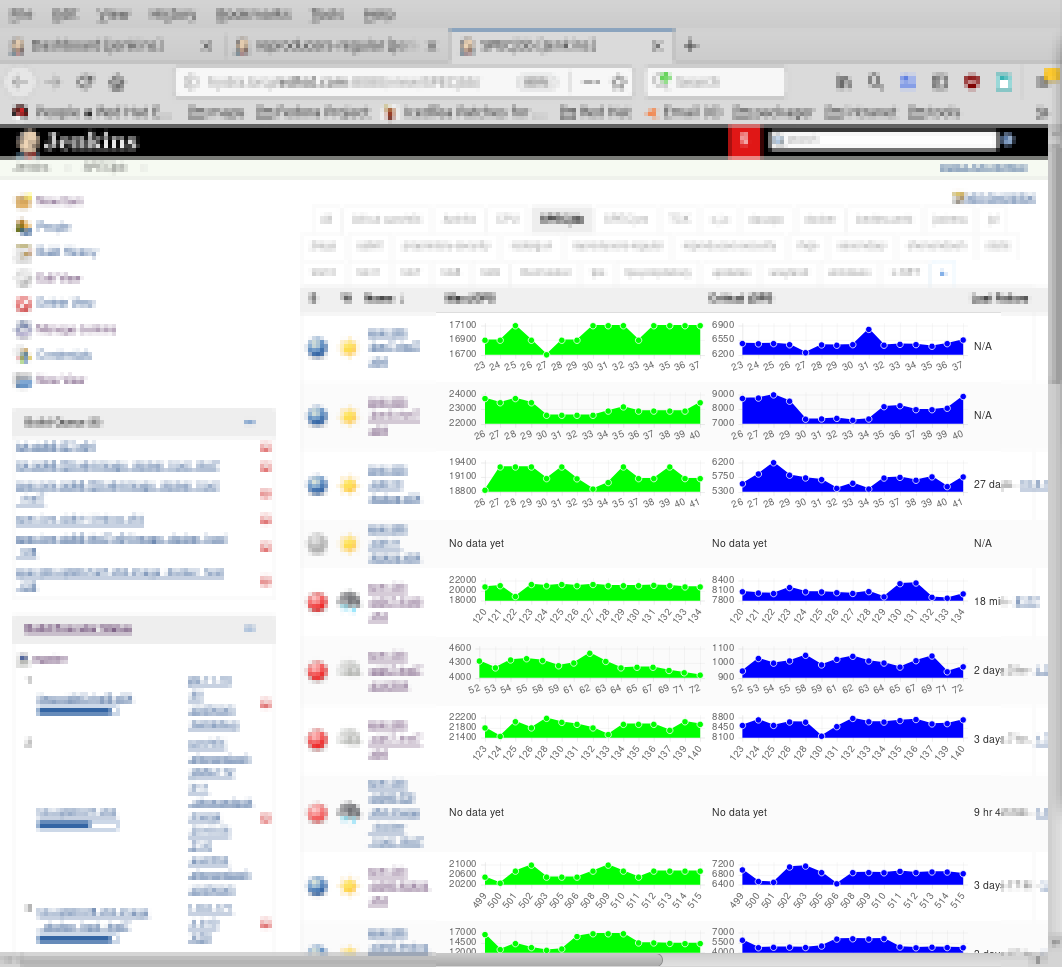 Comparing individual projects was never more simple:)
You can of course mix it with other properties or other plugins 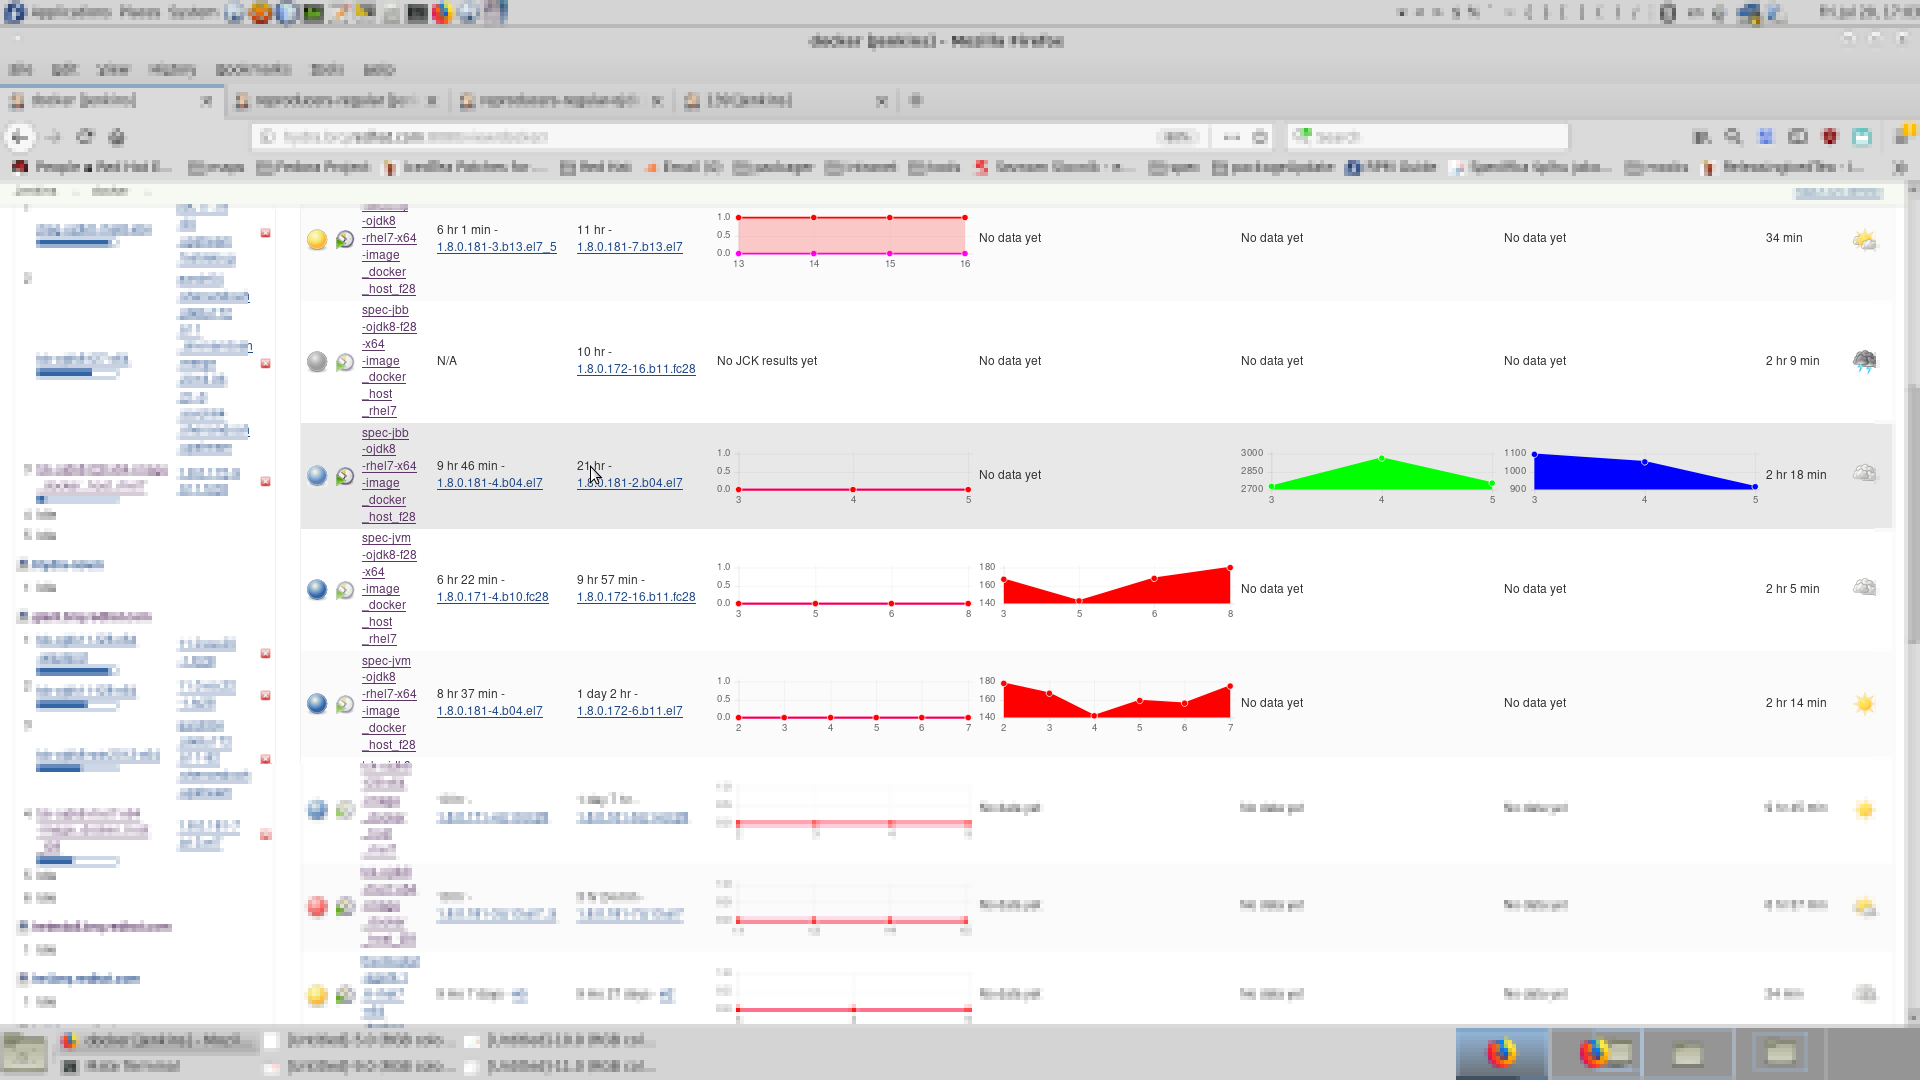
The results in view are sort-able - they are sort by last valid result shown in chart.
Comparing individual projects was never ever more simple:)
Each chart (there can be several by project) can have its own condition, on which result it can turn the build to unstable, if the condition is met. The mathematic part is handled by https://github.com/gbenroscience/ParserNG/, the logic part is internal. Exemplar expression:
avg(..L1)*1.1 < L0 | L1*1.3 < L0
The expression can be read as: If value of key in last build is bigger then average value of all builds before multiplied by 1.1 , or the last build is bigger then previous build multiplied by 1.3, turn the build to unstable
You can read how it is evaluated here: https://github.com/judovana/jenkins-report-generic-chart-column/blob/master/src/main/resources/io/jenkins/plugins/genericchart/ChartModel/help-unstableCondition.html#L10
The built which just ended is L0. Previous build is L1 and so on... You can use ranges - eg L5..L1 will return values of given key for build N-5,N-4-N-3,N-2,N-1 where N is current build - L0. Ranges can go withot limit - eg L3.. will exapnd as L3,L2,L1,L0. So obviously mmost used is ..L1 which returns you values of all except latests (L0) build. Count of points is MN.
The L indexes, can be calcualted. To do so, use L{expression}. Eg L{MN/2} upon 1,2,3, will expand as L{3/2} -> L{1,5} -> L1 -> 2. The brackets can be cumulative (eg L{{1+1}}) and can contain Other L or MN. eg L{L0}. The only reason why this was created was to beable wrote ..L{MN/2} and L{MN/2}..
Next to the cmdline/library of ParserNG where you can try yours expressions, you can do similarly with jenkins-report-generic-chart-column.jar; but it is not exactly straightforward to compose classpath. eg:
VALUES_PNG="1 2 3" java -cp jenkins-report-generic-chart-column.jar:parser-ng-0.1.8.jar io/jenkins/plugins/genericchart/math/ExpandingExpression "sum(..L0) < avg(..L0)"
or
VALUES_PNG="1 2 3" java -cp parser-ng-0.1.8.jar:jenkins-report-generic-chart-column.jar parser.ExpandingExpression "avg(..L{MN/2}) < avg(L{MN/2}..)"
or
VALUES_PNG="1 2 3" java -cp jenkins-report-generic-chart-column.jar:parser-ng-0.1.8.jar io/jenkins/plugins/genericchart/math/ExpandingExpression "sum(..L0) < avg(..L0)"
Currently all necessary changes were moved to ParserNG, including the VALUES_PNG variable. ParserNG have powerfull CLI and since 0.1.9 this expanding parser is here, so you can run it simply as java -jar:
VALUES_PNG='235000 232500 233000 236000 210000' java parser-ng-0.1.9.jar -e " echo(L{MN}..L0) "
or via its interactive CLI
$ VALUES_PNG='235000 232500 233000 236000 210000' java -jar parser-ng-0.1.9.jar -e -i
Output
Welcome To ParserNG Command Line
Math Question 1:
______________________________________________________
echo(L0..L{MN})
Answer
______________________________________________________
210000 236000 233000 232500 235000
Math Question 2:
______________________________________________________
echo(L{MN}..L0)
Answer
______________________________________________________
235000 232500 233000 236000 210000
VALUES_PNG='235000 232500 233000 236000 210000' java -jar parser-ng-0.1.9.jar -e -i -v
Output
Welcome To ParserNG Command Line

Math Question 1:
______________________________________________________
L1<L2
L1<L2
Expression : L1<L2
Upon       : 235000,232500,233000,236000,210000
As         : Ln...L1,L0
MN         = 5
Expanded as: 236000<233000
236000<233000
 brackets: 236000<233000
     evaluating logical: 236000<233000
       evaluating comparison: 236000<233000
         evaluating math: 236000
         is: 236000
         evaluating math: 233000
         is: 233000
       ... 236000 < 233000
       is: false
     is: false
 false
is: false
Answer
______________________________________________________
If something should be some exact result, or must not be an exact result is most easy usage
L0 == 5if last result is 5, then the job will become unstableL0 != 5which is same as![L0 == 5]if last result is NOT 5, then the job will become unstable
threshold=5;-1*(L1/(L0/100)-100) < -thresholdwhich is same asthreshold=5; (L1/(L0/100)-100) > thresholdfor classical benchmark, like score, where more is better. The threshold is how much % is maximal drop it can bear, andthreshold=5; (L1/(L0/100)-100) < -thresholdfor eg size (where smaller is better) benchmark, or time-based where less is better . The threshold is how much % is maximal increase it can bear.- For stable things 5% should be the biggest regression rate. For unstable once usually 10% is OK to cover usual oscillation
- Note, that those equation works fine for both big numbers and small numbers
Such last run against previous run can not catch constant degradation. To avoid that you may simply extends of Immediate regression, only L0 will compared against all previous runs - L1 will become something lile ..L1 (all except last run)
You can then call avg or avgN functions above it or geom or geomN if you have to diverse data with huge thresholds. See parserNG help for descriptions of functions (you can type help also to the Jenkins settings for this equation)
threshold=5;-1*(avg(..L1)/(L0/100)-100) < -thresholdwhich is same asthreshold=5; (avg(..L1)/(L0/100)-100) > thresholdfor classical benchmark, like score, where more is better. The threshold is how much % is maximal drop it can bear, andthreshold=5; (avg(..L1)/(L0/100)-100) < -thresholdfor eg.: size (where smaller is better) benchmark, or time-based where less is better . The threshold is how much % is maximal increase it can bear.
- In basic comparison, you can compare any Lx with any Ly. Eg
(L2/(L0/100)-100) > thresholdor(L{MN}/(L0/100)-100) > thresholdand so on.- The underlying evaluation is lenient, and eg L4 in size in set of two numbers, will have simply value of last valid (second in this case) number.
- That's also why
L{MN}works, although you should be explicitly writingL{MN-1} - example:
VALUES_PNG='3 2 1' java -jar parser-ng-0.1.9.jar -e "echo(L5,L6,L7)"will give you3 3 3
- another,more generic solution, may be achieved by simply extension of Immediate regression, only
L0will be replaced by something likeL0..L{MN/2}(newer half of the set) and L1 byL{MN/2}..L{MN}(older half of the set) - You can then call
avgoravgNfunctions above it orgeomorgeomNif you have to diverse data with huge thresholds. See parserNG help for descriptions of functions (you can typehelpalso to the Jenkins settings for this equation)threshold=5;-1*(avg(L{MN/2}..L{MN})/(avg(L0..L{MN/2})/100)-100) < -thresholdwhich is same asthreshold=5; (avg(L{MN/2}..L{MN})/(avg(L0..L{MN/2})/100)-100) > thresholdfor classical benchmark, where more is better. The threshold is how much % is maximal drop it can bearthreshold=5; (avg(L{MN/2}..L{MN})/(avg(L0..L{MN/2})/100)-100) < -thresholdfor eg time-based or size benchmark, where less is better. The threshold is how much % is maximal increase it can bear.
You usually have more expressions which are catching your regressions, to connect them, you can use logical operators:
java -jar parser-ng-0.1.9.jar -l   "help"
Comparing operators - allowed with spaces:!=, ==, >=, <=, <, >; not allowed with spaces:le, ge, lt, gt,
Logical operators - allowed with spaces:, |, &; not allowed with spaces:impl, xor, imp, eq, or, and
As Mathematical parts are using () as brackets, Logical parts must be grouped by []
Eg:
- for classical benchmarks like score:
threshold=5;-1*(L1/(L0/100)-100) < -threshold || threshold=5;-1*(avg(L{MN/2}..L{MN})/(avg(L0..L{MN/2})/100)-100) < -threshold || threshold=5;-1*(avg(..L1)/(L0/100)-100) < -threshold
- for inverted benchmarks like time or size
threshold=5; (L1/(L0/100)-100) < -threshold || threshold=5; (avg(L{MN/2}..L{MN})/(avg(L0..L{MN/2})/100)-100) < -threshold || threshold=5; (avg(..L1)/(L0/100)-100) < -threshold
Note, that if the variables (eg my threshold above) are filled as they come to end. If you set it in first logical half, it can be reused in second without declaring it again (as I did in above example). Unluckily, you usually have thresholds different. You can re-declare (as I did) the variable or have different one (eg thresholdA and thresholdB) by ParserNG rules.
'avgN' and 'geomN' are usually producing better results, as they are getting rid of random extreme spikes by sorting the input, and removing N lowest and N highest values. N is first parameter. avgN(0,...) is identical to simply avg(...):
VALUES_PNG='5 5 1 8 5 5'  java -jar parser-ng-0.1.9.jar -e "avgN(0,..L0)"
4.833333333
but
VALUES_PNG='5 5 1 8 5 5'  java -jar parser-ng-0.1.9.jar -e "avgN(1,..L0)"
5
as 8 and 1 were removed from list. So:
- for classical benchmarks like score:
cut=2;threshold=5;-1*(L1/(L0/100)-100) < -threshold || threshold=5;-1*(avgN(cut,L{MN/2}..L{MN})/(avgN(cut,L0..L{MN/2})/100)-100) < -threshold || threshold=5;-1*(avgN(cut,..L1)/(L0/100)-100) < -threshold
- for inverted benchmarks like time or size
cut=2;threshold=5; (L1/(L0/100)-100) < -threshold || threshold=5; (avgN(cut,L{MN/2}..L{MN})/(avgN(cut,L0..L{MN/2})/100)-100) < -threshold || threshold=5; (avgN(cut,..L1)/(L0/100)-100) < -threshold
Is what yoy usually end with
As it maybe boring and error-prone to keep repeating complex equations, you can set the equation in the global settings and then just call it via its name - even with different parameters.
There are same named queries already embedded: https://github.com/jenkinsci/report-generic-chart-column-plugin/blob/master/src/main/resources/io/jenkins/plugins/genericchart/presetEquations.json
The preset equations are defined in JSON format:
{
  "id": "EQUATION_NAME",
  "comments": [
    "Description of what this equation does",
    "Parameters: param1, param2, ...",
    "Example: EQUATION_NAME 5 10"
  ],
  "equations": [
    {
      "name": "main",
      "equation": [
        "variable=/*1*/;",
        "expression with /*1*/ /*2*/ ... /*9*/ as placeholders"
      ],
        "descriptions": [
          { "condition": "true","description": ["always shown description" ]},
          { "condition": "/*RESULT*/ eq false ","description": ["answer printed if equation is false"]},
          { "condition": "/*RESULT*/ < 42 ","description": ["descripitpion based on mathematical instead of logical equation. Those may be usefull for intermediate results, but for usage in jenkins, the final result of equations must be true/false"]}
        ]
    }
  ]
}
You can then call EQUATION_NAME arg1 arg2 ... in your unstable condition.
java -jar target/report-generic-chart-column-4.2-SNAPSHOT-with-deps.jar --list will list the queries. You can use this main method to run them. Eg.: java -jar target/report-generic-chart-column-4.2-SNAPSHOT-with-deps.jar "FINAL_DOWN_OK 5 5 5" 12 10 15 2 18 (mind the quotes. First parametr is preset equation with its parameters, all others are the data)
Details
jenkins-report-generic-chart-column Preset Equation Evaluator - for testing purposes only
=========================================================================================
Evaluating preset equation...
Data values: [12, 10, 15, 2, 18]
params: 5, 5, 5
name: FINAL_DOWN_OK

Subcall: IMMEDIATE_DOWN_OK 5
  Subcall: IMMEDIATE_CALC
    Expression : MN
    Upon       : 18,2,15,10,12
    As         : Ln...L1,L0
    MN         = 5
    Expanded as: 5
    is: 5
    Expression : (L1/(L0/100)-100)
    Upon       : 18,2,15,10,12
    As         : Ln...L1,L0
    MN         = 5
    Expanded as: (10/(12/100)-100)
    is: -16.666666666666657
The relative difference between this (12) and previous (10, from total of 5) is: -16.666666666666657%
  Subcall end: IMMEDIATE_CALC
  Expression : threshold=5;   -16.666666666666657 < -threshold
  Upon       : 18,2,15,10,12
  As         : Ln...L1,L0
  MN         = 5
  Expanded as: threshold=5;   -16.666666666666657 < -threshold
    brackets: threshold=5;   -16.666666666666657 < -threshold
        evaluating logical: threshold=5;   -16.666666666666657 < -threshold
          evaluating comparison: threshold=5;   -16.666666666666657 < -threshold
            evaluating math: threshold=5;   -16.666666666666657
            is: -16.666666666666657
            evaluating math: -threshold
            is: -5
          ... -16.666666666666657 < -5
          is: true
        is: true
    true
  is: true
This calculation is ensuring, that 'less is better', on immediate scale with tolerance of 5%.
The result, whether rise (in %) against previous run was not greater then threshold is true:
The -16.666666666666657% is lower then threshold -5%, that is bad. You are facing momentary performance regression.
Subcall end: IMMEDIATE_DOWN_OK 5
Subcall: SHORT_DOWN_OK 5
  Subcall: SHORT_CALC
    Expression : MN-1
    Upon       : 18,2,15,10,12
    As         : Ln...L1,L0
    MN         = 5
    Expanded as: 5-1
    is: 4.0
    Expression : avg(..L1)
    Upon       : 18,2,15,10,12
    As         : Ln...L1,L0
    MN         = 5
    Expanded as: avg(18,2,15,10)
    is: 11.25
    Expression : (11.25/(L0/100)-100)
    Upon       : 18,2,15,10,12
    As         : Ln...L1,L0
    MN         = 5
    Expanded as: (11.25/(12/100)-100)
    is: -6.25
The 11.25 is the avg of:18,2,15,10
The relative difference between this (12) and avg(11.25) of previous(4.0) values is: -6.25%
  Subcall end: SHORT_CALC
  Expression : threshold=5;   -6.25 < -threshold
  Upon       : 18,2,15,10,12
  As         : Ln...L1,L0
  MN         = 5
  Expanded as: threshold=5;   -6.25 < -threshold
    brackets: threshold=5;   -6.25 < -threshold
        evaluating logical: threshold=5;   -6.25 < -threshold
          evaluating comparison: threshold=5;   -6.25 < -threshold
            evaluating math: threshold=5;   -6.25
            is: -6.25
            evaluating math: -threshold
            is: -5
          ... -6.25 < -5
          is: true
        is: true
    true
  is: true
This calculation is ensuring, that 'less is better', against all (avg) previous runs with tolerance of 5%.
The result,  whether rise (in %) against avg of previous run was not greater then threshold is true:
The -6.25% is lower then threshold -5%, that is bad. You are facing performance regression.
Subcall end: SHORT_DOWN_OK 5
Subcall: LONG_DOWN_OK 5
  Subcall: LONG_CALC
    Expression : MN/2
    Upon       : 18,2,15,10,12
    As         : Ln...L1,L0
    MN         = 5
    Expanded as: 5/2
    is: 2.5
There is 5 of values, each half will have 2.5 members:  12,10,15,2,18
    Expression : avg(L{MN/2}..L{MN})
    Upon       : 18,2,15,10,12
    As         : Ln...L1,L0
    MN         = 5
      L indexes brackets: avg(L{5/2}..L{5})
        Expression : 5/2
        Expanded as: 5/2
        is: 2.5
        5/2 = 2 (2.5)
      to: avg(L 2 ..L{5})
        Expression : 5
        Expanded as: 5
        is: 5
        5 = 5 (5)
      to: avg(L 2 ..L 5 )
    Expanded as: avg(15,2,18 )
    is: 11.66666667
11.66666667 is avg of upper half (2.5-5) of: 15,2,18
    Expression : avg(L0..L{MN/2})
    Upon       : 18,2,15,10,12
    As         : Ln...L1,L0
    MN         = 5
      L indexes brackets: avg(L0..L{5/2})
        Expression : 5/2
        Expanded as: 5/2
        is: 2.5
        5/2 = 2 (2.5)
      to: avg(L0..L 2 )
    Expanded as: avg(12,10,15 )
    is: 12.33333333
12.33333333 is avg of lower half (0-2.5) of: 12,10,15
    Expression : (11.66666667/(12.33333333/100)-100)
    Upon       : 18,2,15,10,12
    As         : Ln...L1,L0
    MN         = 5
    Expanded as: (11.66666667/(12.33333333/100)-100)
    is: -5.405405352812281
The relative difference between avgs of lower and upper half of original array is: -5.405405352812281%
  Subcall end: LONG_CALC
  Expression : threshold=5;   -5.405405352812281 < -threshold
  Upon       : 18,2,15,10,12
  As         : Ln...L1,L0
  MN         = 5
  Expanded as: threshold=5;   -5.405405352812281 < -threshold
    brackets: threshold=5;   -5.405405352812281 < -threshold
        evaluating logical: threshold=5;   -5.405405352812281 < -threshold
          evaluating comparison: threshold=5;   -5.405405352812281 < -threshold
            evaluating math: threshold=5;   -5.405405352812281
            is: -5.405405352812281
            evaluating math: -threshold
            is: -5
          ... -5.405405352812281 < -5
          is: true
        is: true
    true
  is: true
This calculation is ensuring, that 'less is better', between avgs of older half and newer half runs with tolerance of 5%.
The result,  whether rise (in %) of newer half, against older half is not greater then threshold is true:
The -5.405405352812281% is lower then threshold -5%, that is bad. You are facing long-term performance regression.
Subcall end: LONG_DOWN_OK 5
Expression : true   ||  true   ||  true
Upon       : 18,2,15,10,12
As         : Ln...L1,L0
MN         = 5
Expanded as: true   ||  true   ||  true
  brackets: true   ||  true   ||  true
      evaluating logical: true   ||  true   ||  true
        evaluating comparison: true
        is: true
        evaluating comparison: true
        is: true
      ... true | true
        evaluating comparison: true
        is: true
      ... true | true
      is: true
  true
is: true
In combination `less is better` without cutting of extremes calculated via average values, the result is true:
At least one of them (see above) failed (is true), that is bad. Performance regression detected.
Evaluation result: true
Note that calculation is going to stderr so you can move it away by plain rediraction.
Since v5.0, equations can give answeres. This is highly reocmended way of usage. If there are answers, the computation itself is not printed. See the difference:
Details
### 5/6 eshop-scale.hf.geom from totals.properties
jdk.21.0.11.7-1.ojdk21~u~upstream/7: 591 SUCCESS (this)
jdk.21.0.8.7-0.ojdk21~u~upstream/6: 599 SUCCESS
jdk.21.0.7.4-0.ojdk21~u~upstream/5: 594 UNSTABLE
jdk.21.0.6.6-0.ojdk21~u~upstream/4: 570 UNSTABLE
jdk.21.0.4.6-0.ojdk21~u~upstream/3: 596 UNSTABLE
jdk.21.0.4.5-0.ojdk21~u~upstream/2: 612 SUCCESS
shortened values (shown reverted, newest->oldest): 591,599,594,570,596,612
  The relative difference between this (591) and previous (599, from total of 6) is: 1.3536379018612479%
  This calculation is ensuring, that 'more is better', on immediate scale with tolerance of 5%.
  The result, whether drop (in %) against previous run was not greater then threshold is false:
  The 1.3536379018612479% is lower or equal to threshold 5%, that is ok.
  The 596.3333333 is the average value (with 2 lowest and 2 biggest values removed) from: [570, 594, 596, 599, 612]
  The relative difference between this (591) and filtered avg(596.3333333) of original 6 (after cut: 2.0) values is: 0.902425262267343%
  This calculation is ensuring, that 'more is better', against all - with 2*2 extremes excluded - previous runs with tolerance of 2%.
  The result,  whether drop (in %) against avg (with the removed extremes) of previous run was not greater then threshold is false:
  The 0.902425262267343% is lower or equal to threshold 2%, that is ok.
  warning, not enough data values for safe calculation (6). Should be at lest 4*2+1 (9.0).
  The 592.6666667 is the average value (with 2 lowest and 2 biggest values removed) from: [570, 596, 612]
  The 592.5 is the average value (with 2 lowest and 2 biggest values removed) from: [570, 591, 594, 599]
  The relative difference between filtered avgs of newer half of data (592.6666667) and older half of data (592.5) of original 6 (after 2x cut of 0.0) values is: 0.028129400843880603%
  This calculation is ensuring, that 'more is better', between newer half of data, and older half of data with (for each half) 2*2 extremes excluded with tolerance of 2%.
  The result,  whether drop (in %) of avg of newer half (with the removed extremes) against older half (with extremes removed) is false:
  The 0.028129400843880603% is lower or equal to threshold 2%, that is ok.
  In combination `more is better` with cutting of extremes calculated via average values, the result is false:
  All passed (all checks are false). No performance regression noticed.
Result of eshop-scale.hf.geom from totals.properties is false, that is ok.

### 6/6 random-urls.hf.geom from totals.properties
jdk.21.0.11.7-1.ojdk21~u~upstream/7: 1598 SUCCESS (this)
jdk.21.0.8.7-0.ojdk21~u~upstream/6: 1196 SUCCESS
jdk.21.0.7.4-0.ojdk21~u~upstream/5: 1073 UNSTABLE
jdk.21.0.6.6-0.ojdk21~u~upstream/4: 1259 UNSTABLE
jdk.21.0.4.6-0.ojdk21~u~upstream/3: 1196 UNSTABLE
jdk.21.0.4.5-0.ojdk21~u~upstream/2: 1137 SUCCESS
shortened values (shown reverted, newest->oldest): 1598,1196,1073,1259,1196,1137
Expression : L1+L2 ltL3
Upon       : 1137,1196,1259,1073,1196,1598
As         : Ln...L1,L0
MN         = 6
Expanded as: 1196+1073 lt 1259
  brackets: 1196+1073 lt 1259
      evaluating logical: 1196+1073 lt 1259
        evaluating comparison: 1196+1073 lt 1259
          evaluating math: 1196+1073
          is: 2269.0
          evaluating math: 1259
          is: 1259
        ... 2269.0 lt 1259
        is: false
      is: false
  false
is: false
5/6 have answers set. 6/6 is plain definition.
Id you still need equations evalutaions printed, you may use property/var log_equation/LOG_EQUATION to force it. You can use log_comments/LOG_COMMENTS to print also hints to to the preset functions.
You can declare the json or even url and point jenkins/tools to them via preset_defs/PRESET_DEFS.
See https://github.com/jenkinsci/report-generic-chart-column-plugin/blob/master/src/main/resources/io/jenkins/plugins/genericchart/equations/README.md for more info about how to create custom preset definitions
See examples and don't forget you can set up your own in global settings (also in JSON format).
you could noted, that the graphs are scaled. If you have run, which escapes the normality, the scale get corrupted, and you can easily miss regression. To fix this, you have denylist (and allowlist). This is list of regexes, which filters (first) out and (second) in the (un)desired builds. It works both with custom_built_name and #build_number (note the hash). Empty denylist/allowlist means it is not used at all.
Project settings and view settings are separate - with both pros and cons!
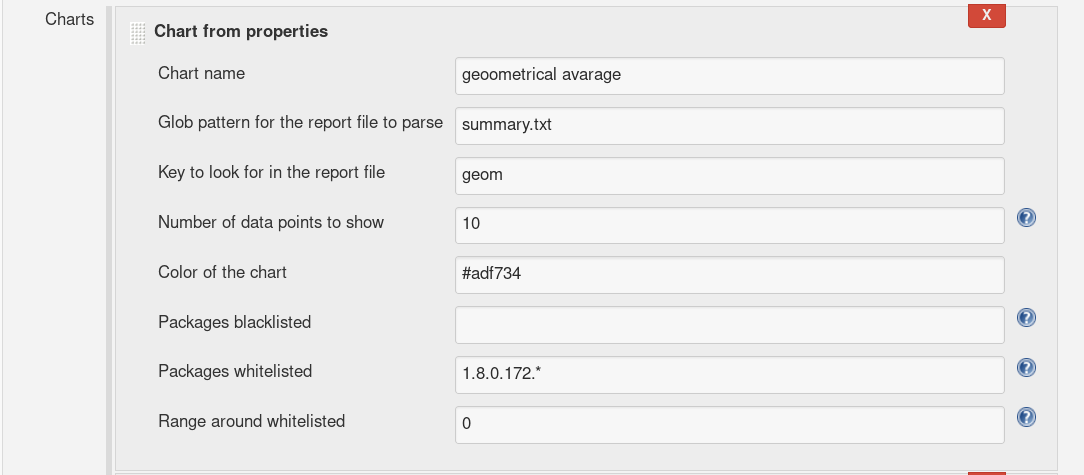
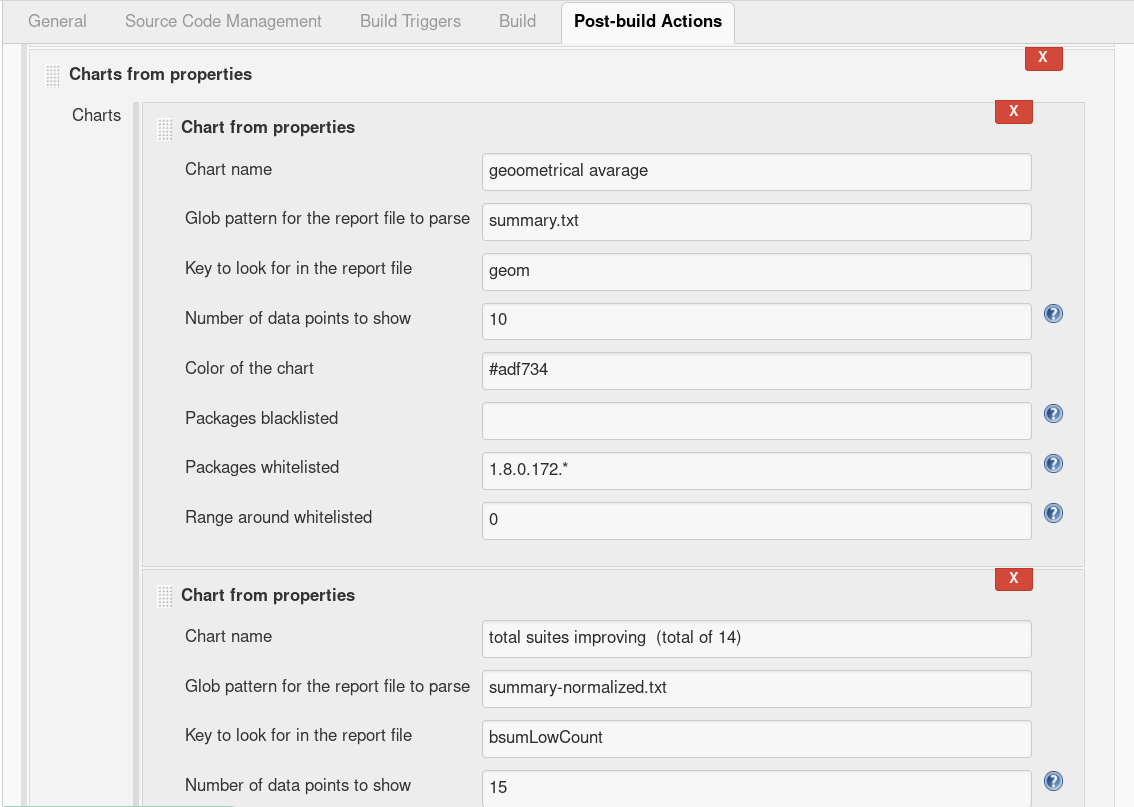 Most important is Glob pattern for the report file to parse, which lets you specify not absolute (glob) path to your properties file and of course Key to look for in the report file which tells chart what value to render. Chart name and color are cosmetic, denylist and allowlist were already described. Number of data points to show is how many successful builds (counted from end) should be displayed. If you are in doubts, each suspicious field have help.
Project settings and view settings are separate - with both pros and cons!
 You can see that the settings of view are same - thus duplicated with all its pros and cons...
The limitations flows from double settings and from fact that each chart can show only only one value. The non-shared denylist/allowlist is a negative which we are working on to improve. One line only is considered as - due to scaled graph - definitely positive.
Number of points before and after chosen point using allowlist. For example if you have allowlisted 3 and 4 and range is 2 graph will show points 1 2 3 4 5 6. 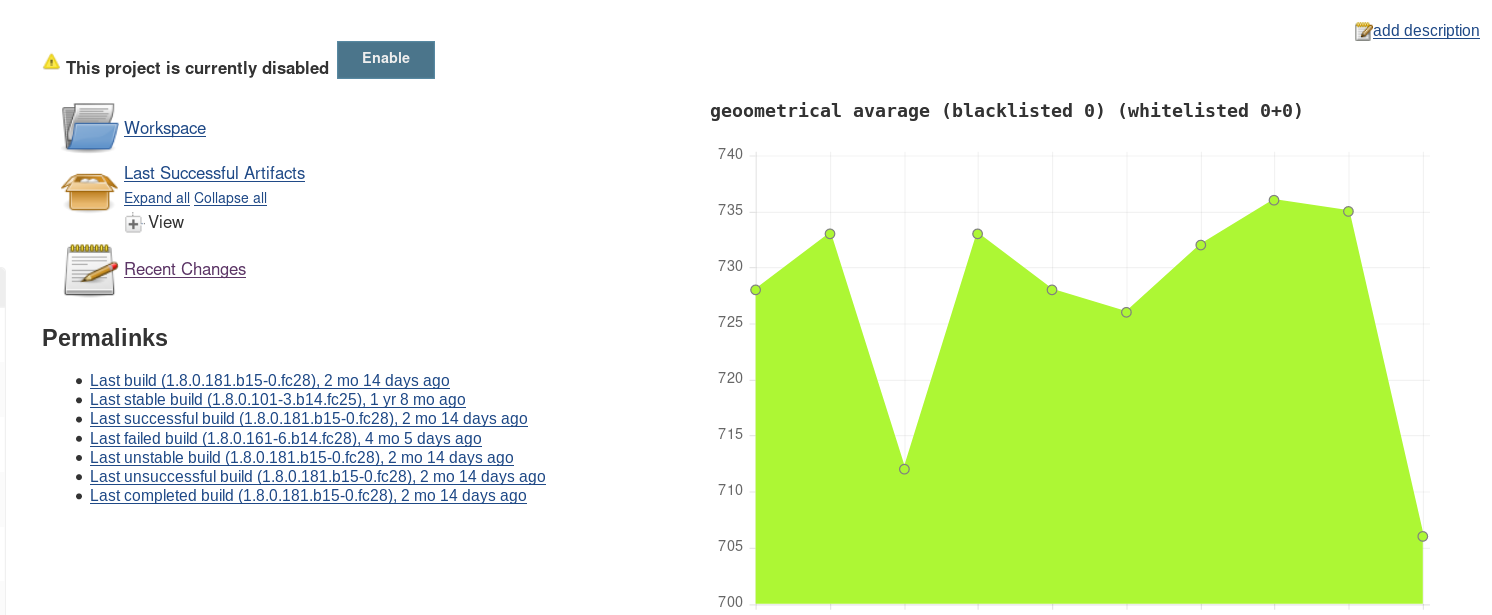 Up is without allowlisted and range. Down is with allowlist (1.8.0.172.*) and range (3).
  Up is with allowlist (1.8.0.172.*) and range (3). Down is with allowlist (1.8.0.172.*) and without range.
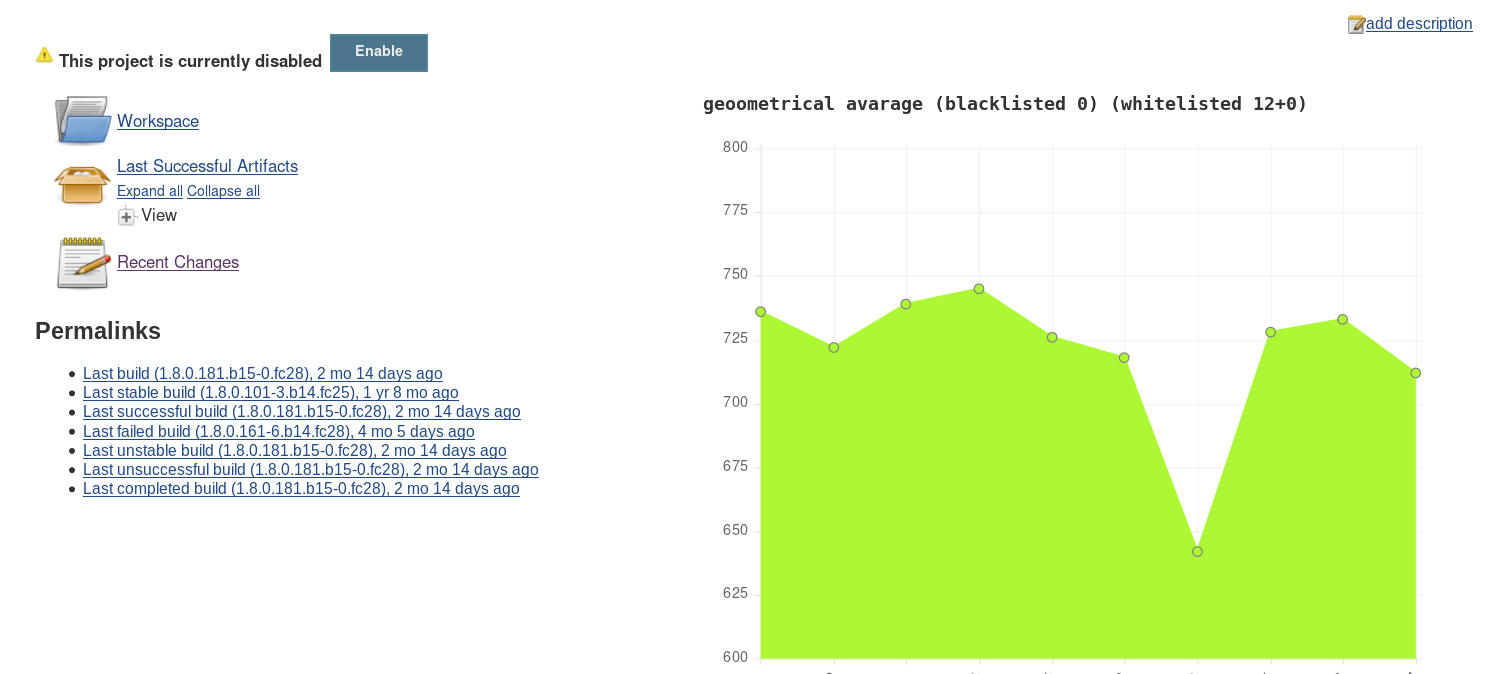
We wish to improve allowlist/denylist feature, so it can be used to generate views comparing selected runs across jobs with some kind of neighborhood
This plugin depends on chartjs-api library plugin and on parser-ng math library 1.9 or up