Table of Contents
Red Hat Dependency Analytics
Red Hat Dependency Analytics (RHDA) is a Jenkins plug-in developed by Red Hat Inc.
'RHDA Report' with Insights about your application dependencies:
- Flags a security vulnerability(CVE) and suggests a remedial version
- Shows Github popularity metrics along with latest version
- Suggests a project level license, check for conflicts between dependency licences
- AI based guidance for additional, alternative dependencies
The plugin can be used in Jenkins as a pipeline task or as a build step.
How to use the plugin
Admin Steps
1. Install the redhat-dependency-analytics Jenkins plugin
- From the Jenkins Dashboard, click Manage Jenkins -> Plugins -> Available Plugins.
- If Maven is not installed, search for Maven Integration, and install the plug in.
- Search for redhat-dependency-analytics, and install the plug in.
- Restart Jenkins.
2. Configuration
Make sure that the Path is updated to point to the corresponding executables, like mvn, pip etc.
Customization
To set a custom path for package managers use environment variables.
- Click on Manage Jenkins -> System, scroll down to Global properties/Environment Variables.
- Set the corresponding custom path based on your project:
- For Maven - Set Name:
TRUSTIFY_DA_MVN_PATHand Value:/path/to/custom/mvn. - For Gradle - Set Name:
TRUSTIFY_DA_GRADLE_PATHand Value:/path/to/custom/gradle. - For NPM - Set Name:
TRUSTIFY_DA_NPM_PATHand Value:/path/to/custom/npm. - For Yarn - Set Name:
TRUSTIFY_DA_YARN_PATHand Value:/path/to/custom/yarn. - For PNPM - Set Name:
TRUSTIFY_DA_PNPM_PATHand Value:/path/to/custom/pnpm. - For GO - Set Name:
TRUSTIFY_DA_GO_PATHand Value:/path/to/custom/go. - For Python3 - Set Name:
TRUSTIFY_DA_PYTHON3_PATHand Value:/path/to/custom/python3. - For Pip3 - Set Name:
TRUSTIFY_DA_PIP3_PATHand Value:/path/to/custom/pip3. - For Python - Set Name:
TRUSTIFY_DA_PYTHON_PATHand Value:/path/to/custom/python. - For Pip - Set Name:
TRUSTIFY_DA_PIP_PATHand Value:/path/to/custom/pip.
- For Maven - Set Name:
General Configuration
Click Manage Jenkins. Click System, and scroll down to Global properties/Environment Variables. Here you can configure the following settings:
-
name:
TRUSTIFY_DA_BACKEND_URL. Description: Will allow you to use a different Red Hat Dependency Analytics Backend. Defaults to the production environment. -
name:
TRUSTIFY_DA_PROXY_URL. Description: You can configure a proxy for all HTTP requests made by the API. This is useful when your environment requires going through a proxy to access external services. -
name:
HIGHEST_ALLOWED_VULN_SEVERITY, Possible values: [LOW,MEDIUM,HIGH,CRITICAL], Description: will determine what is the highest allowed Severity of a vulnerability found for a given package/dependency in the analysis, for the analysis to be considered Successful(RC=0) and not Vulnerable(RC=2), Default value isMEDIUM
Python Pipeline Configuration
By default, Python support assumes that the package is installed using the pip/pip3 binary on the system PATH, or of the customized Binaries passed to environment variables. If the package is not installed , then an error will be thrown.
There is an experimental feature of installing the requirement.txt on a virtual env(only python3 or later is supported for this feature) - in this case, it's important to pass in a path to python3 binary as TRUSTIFY_DA_PYTHON3_PATH or instead make sure that python3 is on the system path. in such case, You can use that feature by setting environment variable TRUSTIFY_DA_PYTHON_VIRTUAL_ENV to true
For Python PIP packages, you can use the specific Python and PIP binaries during the invocation of the analysis. You can also specify these binaries elsewhere in your pipeline jobs, such as a stage environment, or another agent or node. Red Hat Dependency Analytics gives you maximum flexibility with the Python and PIP versions. You do not have to enforce the user to install different Python and PIP versions just to adapt it to the exact requirements.txt list of package versions. Python is very sensitive to versioning, for each Python version, there is a limited range of supported versions for a package.
There are two environment variables:
TRUSTIFY_DA_PIP_FREEZETRUSTIFY_DA_PIP_SHOW
This feature enables you to use Python for different agents. For example, a Python container image containing the desired Python version you want to do the analysis with. You can install the input requirements.txt file using PIP within the container image, and then you can use the following commands to generate the output for a files in workspace : pip freeze --all and pip show <list_of_packages>. Next, run base64 to encode the output from these commands, and set the TRUSTIFY_DA_PIP_FREEZE and TRUSTIFY_DA_PIP_SHOW environment variables with that encoded output, respectively.
Example pipeline with proper usage:
node {
    def dockerArguments= '--user=root'
    def pipFreezeOutput
    def pipShowOutput
    def pythonImage = "python:${params.PYTHON_VERSION}-slim"
    def gitRepoWithRequirements = "${params.REQUIREMENTS_GIT_REPO}"
    def gitRepoWithRequirementsBranch = "${params.REQUIREMENTS_GIT_BRANCH}"


    stage('Checkout Git Repo') { // for display purposes
        // Get some code from a GitHub repository
        dir('requirementsDir') {
            git  branch: gitRepoWithRequirementsBranch, url: gitRepoWithRequirements
        }

    }

    stage('Install Python Package') {
        docker.withTool('docker-tool') {
            docker.withServer('tcp://localhost:2376','docker-server-certs'){

                docker.image(pythonImage).inside(dockerArguments) {
                    sh 'pip install -r requirementsDir/requirements.txt'
                    pipFreezeOutput = sh(script: "pip freeze --all" ,returnStdout: true ).trim()
                    writeFile([file: 'pip-freeze.txt', text: pipFreezeOutput])
                    pipFreezeOutput = sh(script: "pip freeze --all | awk -F \"==\" '{print \$1}' | tr \"\n\" \" \"" ,returnStdout: true ).trim()
                    pipShowOutput = sh(script:"pip show ${pipFreezeOutput}" ,returnStdout: true )
                    writeFile([file: 'pip-show.txt', text: pipShowOutput])


                }
            }
        }
    }
    stage('RHDA Run Analysis') {
        def pipFreezeB64= sh(script: 'cat pip-freeze.txt | base64 -w0' ,returnStdout: true ).trim()
        def pipShowB64= sh(script: 'cat pip-show.txt | base64 -w0',returnStdout: true ).trim()
        echo "pipFreezeB64= ${pipFreezeB64}"
        echo "pipShowpipShowB64= ${pipShowB64}"
        withEnv(["TRUSTIFY_DA_PIP_FREEZE=${pipFreezeB64}","TRUSTIFY_DA_PIP_SHOW=${pipShowB64}"]) {

            rhdaAnalysis consentTelemetry: true, file: "${WORKSPACE}/requirementsDir/requirements.txt"
        }

    }

    stage('Clean Workspace') {
        cleanWs cleanWhenAborted: false, cleanWhenFailure: false, cleanWhenNotBuilt: false, cleanWhenUnstable: false
    }

}
"Best Efforts Installation"
Since Python pip packages are very sensitive/picky regarding python version changes( every small range of versions is only tailored for a certain python version), I'm introducing this feature, that tries to install all packages in requirements.txt onto created virtual environment while disregarding versions declared for packages in requirements.txt This increasing the chances and the probability a lot that the automatic installation will succeed.
Usage
A New setting is introduced - TRUSTIFY_DA_PYTHON_INSTALL_BEST_EFFORTS (as both env variable/key in options object)
TRUSTIFY_DA_PYTHON_INSTALL_BEST_EFFORTS="false" - install requirements.txt while respecting declared versions for all packages.
TRUSTIFY_DA_PYTHON_INSTALL_BEST_EFFORTS="true" - install all packages from requirements.txt, not respecting the declared version, but trying to install a version tailored for the used python version, when using this setting,you must set setting MATCH_MANIFEST_VERSIONS="false"
Using The Plugin
Option 1 - As a build step
-
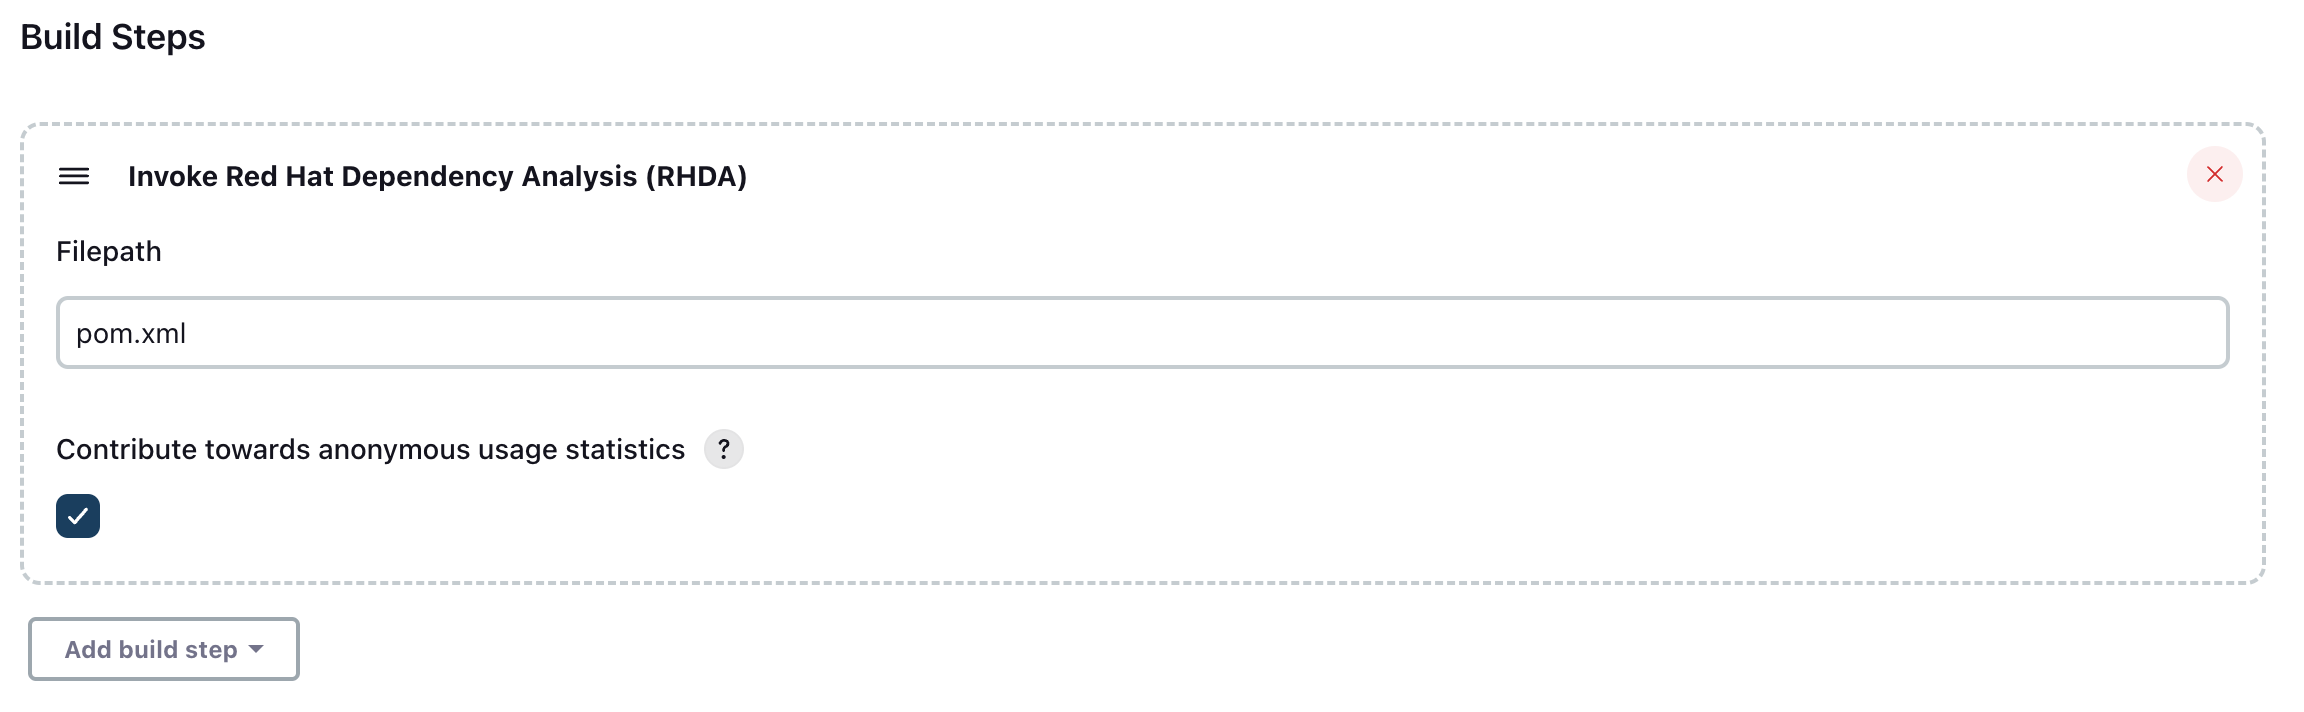
Click on Configure -> Build Trigger -> Add Build Step. Select
Invoke Red Hat Dependency Analytics (RHDA). -
Filepath (Mandatory): Provide the filepath for the manifest file. We currently support the following
- Maven: pom.xml
- Gradle: build.gradle / build.gradle.kts
- Python: requirements.txt
- Npm/Pnpm/Yarn: package.json
- Golang: go.mod
-
Usage Statistics (Optional): Consent given to red hat to collect some usage statistics to improve the plugin and report. Default consent is false.
NOTE: If you get a Java runtime error because the build can not find the
mvnbinary, try doing the following steps:- From the Jenkins Dashboard, click Manage Jenkins -> Tools -> Maven Installations -> click Add Maven -> Enter a name on Maven Name -> check Install automatically -> click Save
- From the Jenkins Dashboard, click Manage Jenkins -> System -> Check Environment Variables, click Add.
- Enter TRUSTIFY_DA_MVN_PATH as the variable name, with the value pointing to the
mvnbinary from the Maven Integration installation. For example, a value of$JENKINS_HOME/tools/hudson.tasks.Maven_MavenInstallation/<Maven Name from Step 1>/bin/mvn. - Include Invoke top-level maven targets as a build step by specifying the Maven version, and add clean install as a goal for the new pipeline item.
Option 2 - As a pipeline task
- Its just a single line that you need to add in your pipeline script.
rhdaAnalysis file:'manifest file path', consentTelemetry:trueThe value description remains the same as provided in the Option I. User can also use the pipeline snippet generator to generate the command.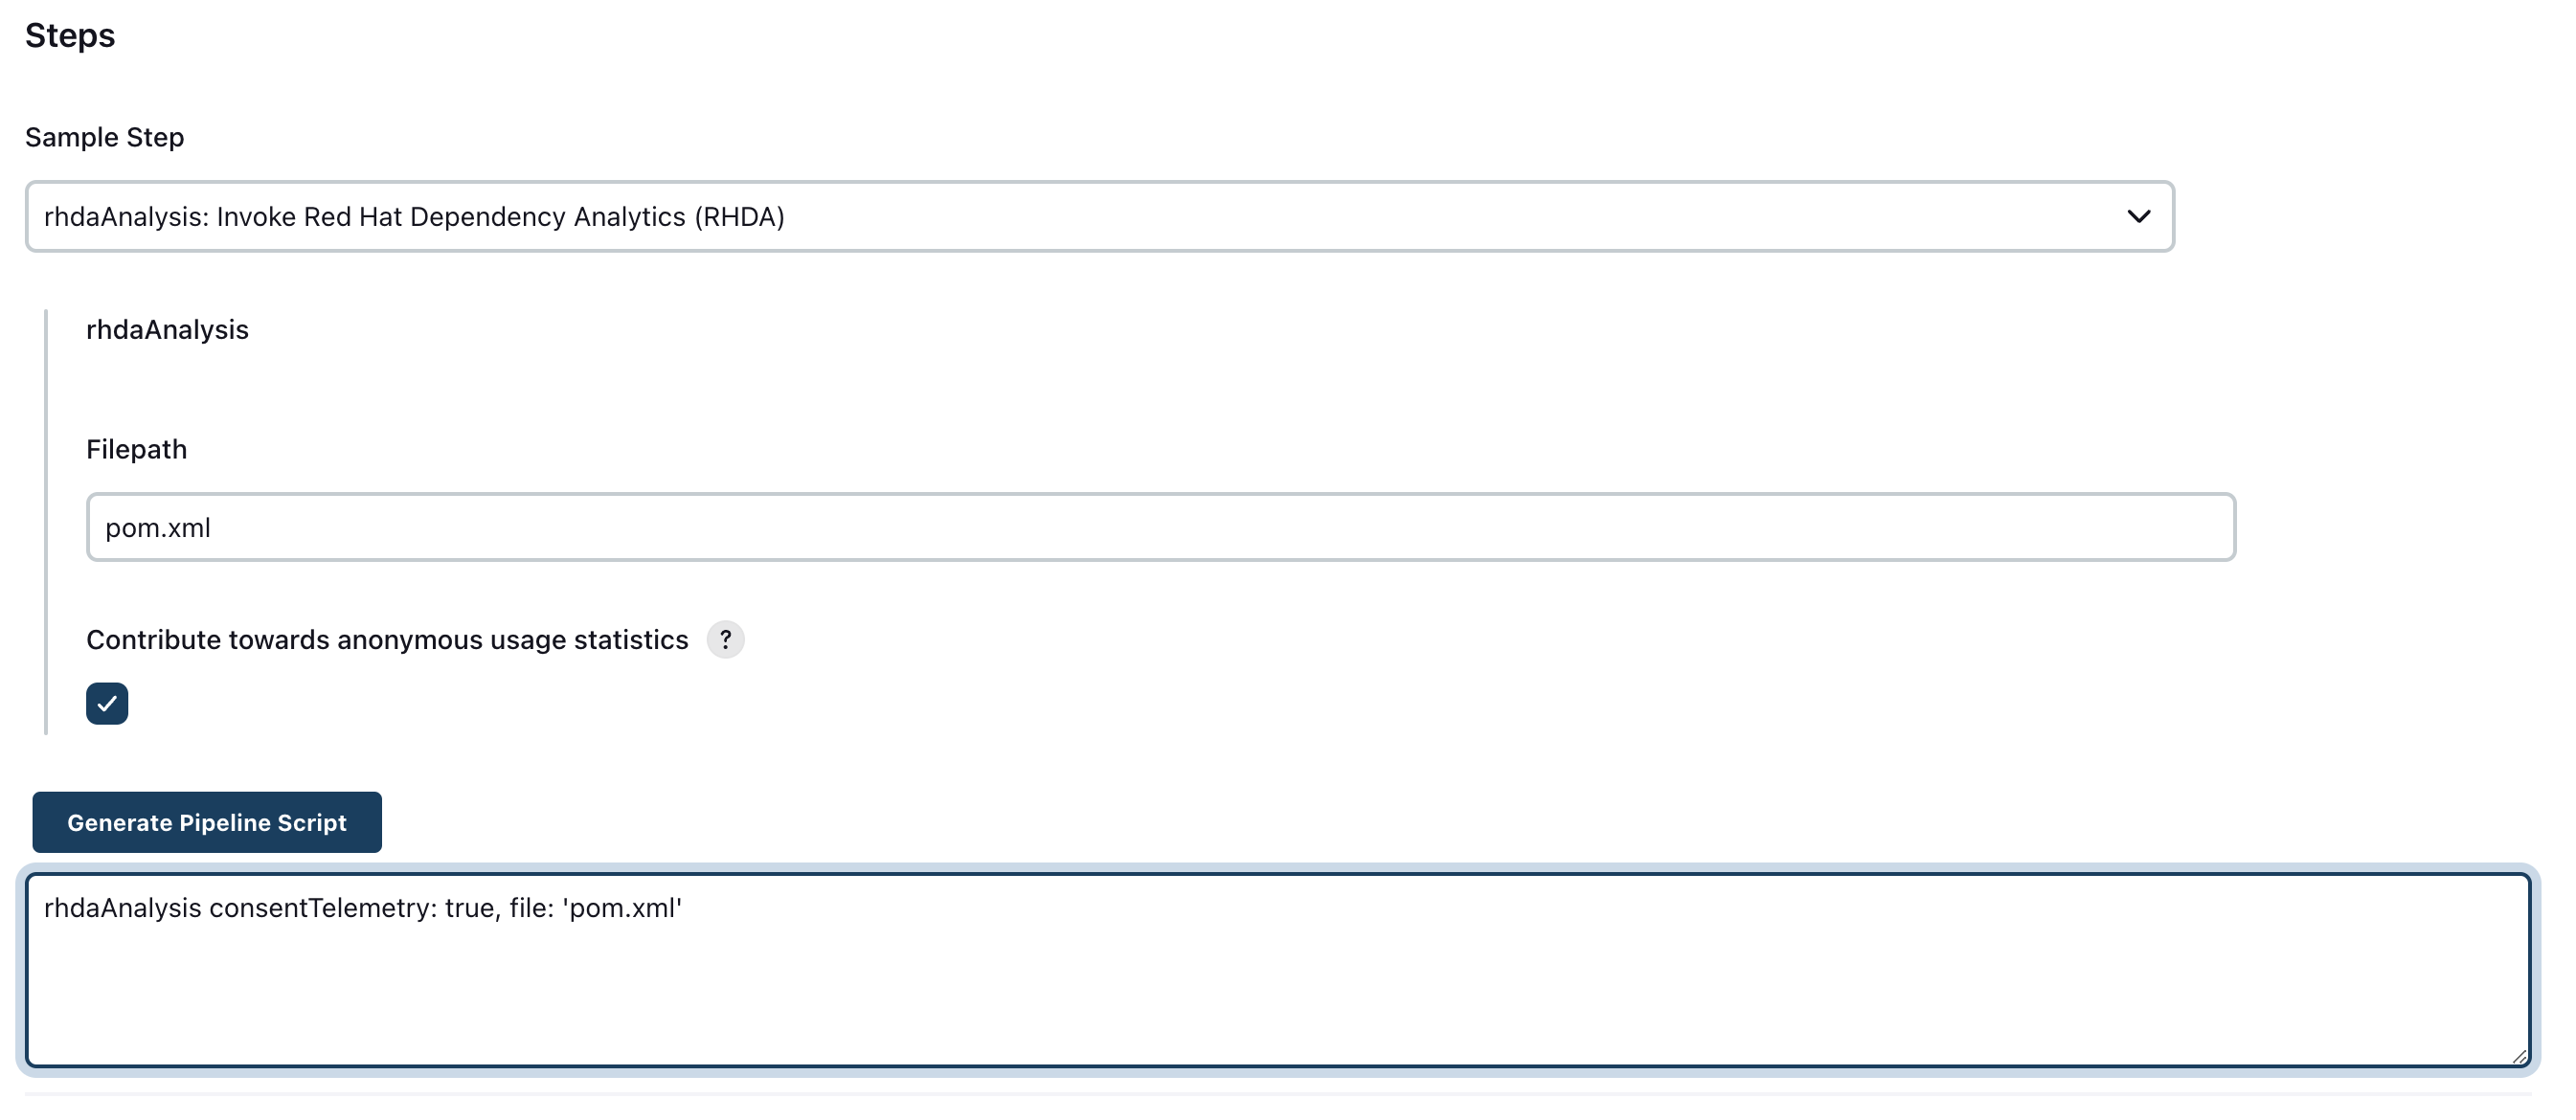
Example basic pipeline
NOTE: The package manager binaries have to be in the pipeline's invoking machine, such as a Jenkins master or agent, for this declarative pipeline to work properly.
pipeline {
    agent any
    stages {
        stage('Checkout') {
            steps {
                // Checkout the Git repository
                checkout([$class: 'GitSCM', branches: [[name: 'main']], userRemoteConfigs: [[url: '[https://github.com/Your github project link.git']]](https://github.com/Your github project link.git)])
            }
        }
        stage ('Install requirements.txt if Python PIP') {
            steps {
                script {
                    if (fileExists('requirements.txt')) {
                        sh 'pip install -r requirements.txt'
                    }
                }
            }
        }
        stage('RHDA Step') {
            steps {
                echo 'RHDA'
                rhdaAnalysis consentTelemetry: true, file: 'manifestName.extension'
            }
        }
    }
}
Return Code From Plugin
- It returns 3 different exit status code
- 0: SUCCESS - Analysis is successful and there were no vulnerabilities found with a severity that exceeded the highest severity allowed in the dependency stack.
- 1: ERROR - Analysis encountered an error.
- 2: VULNERABLE - Analysis is successful, but it found 1 or more vulnerabilities that Their Severity Exceeds the Highest Severity Allowed in the dependency stack.
Results
There are a total 3 ways to view the results of the analysis.
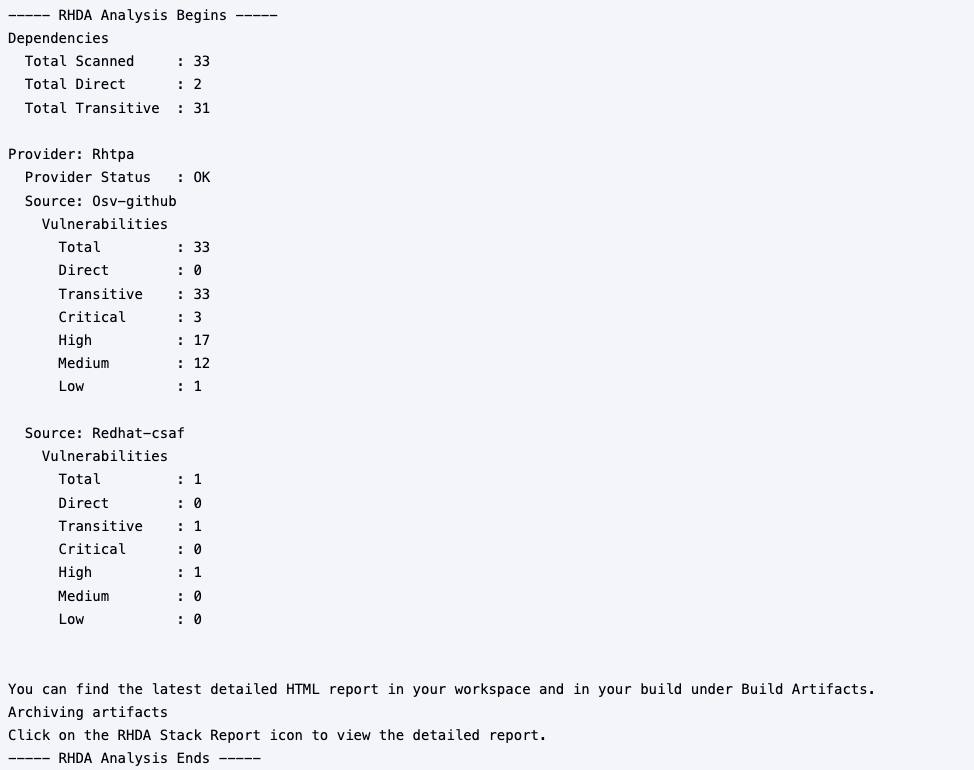
1. Console Output
This provides the count and types of vulnerabilities found in the dependency stack. This data is generated for every build and can be viewed in the corresponding console log. It also provides a link to the detailed report.
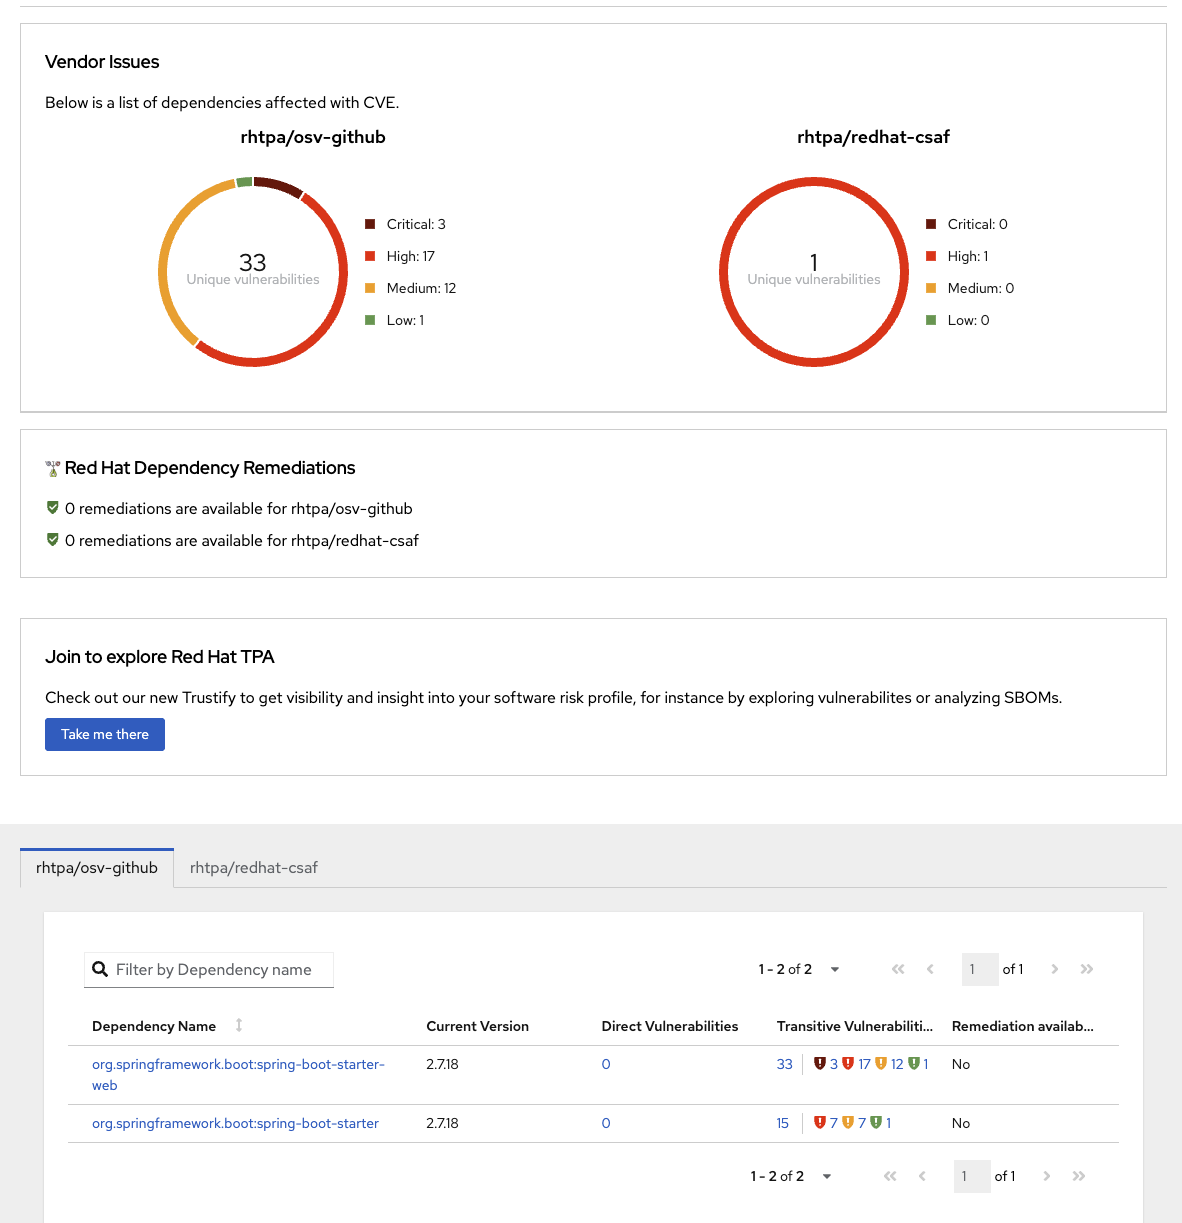
2. RHDA Stack Report
After every successful analysis, you can find a new icon added in the left panel named
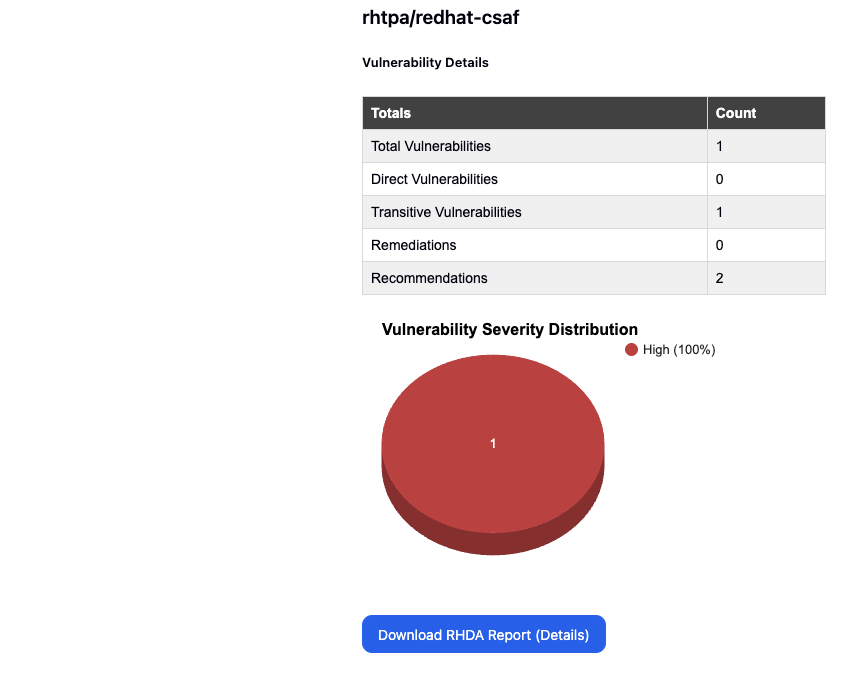
RHDA Stack Report. Click on this icon to view the report in graphical form. You will see the details for each Provider and Source retrieved.
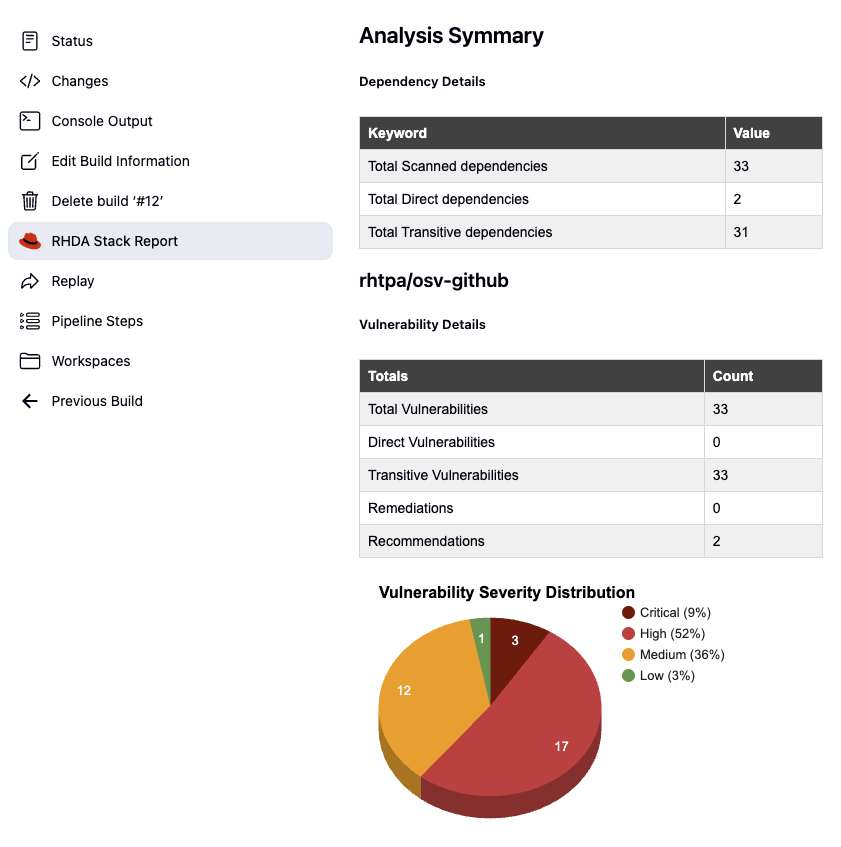
At the end you will also find a button to download an extended HTML version of the report.
3. Detailed RHDA Stack Report
The stack report can be accessed via 2 ways, as mentioned in point number 1 (via url) and 2 (via button click). The report provides comprehensive details about each vulnerability, each dependency in the stack along with the license analysis and the recommended companions.