--- Brings some DevOps to your Jenkins !
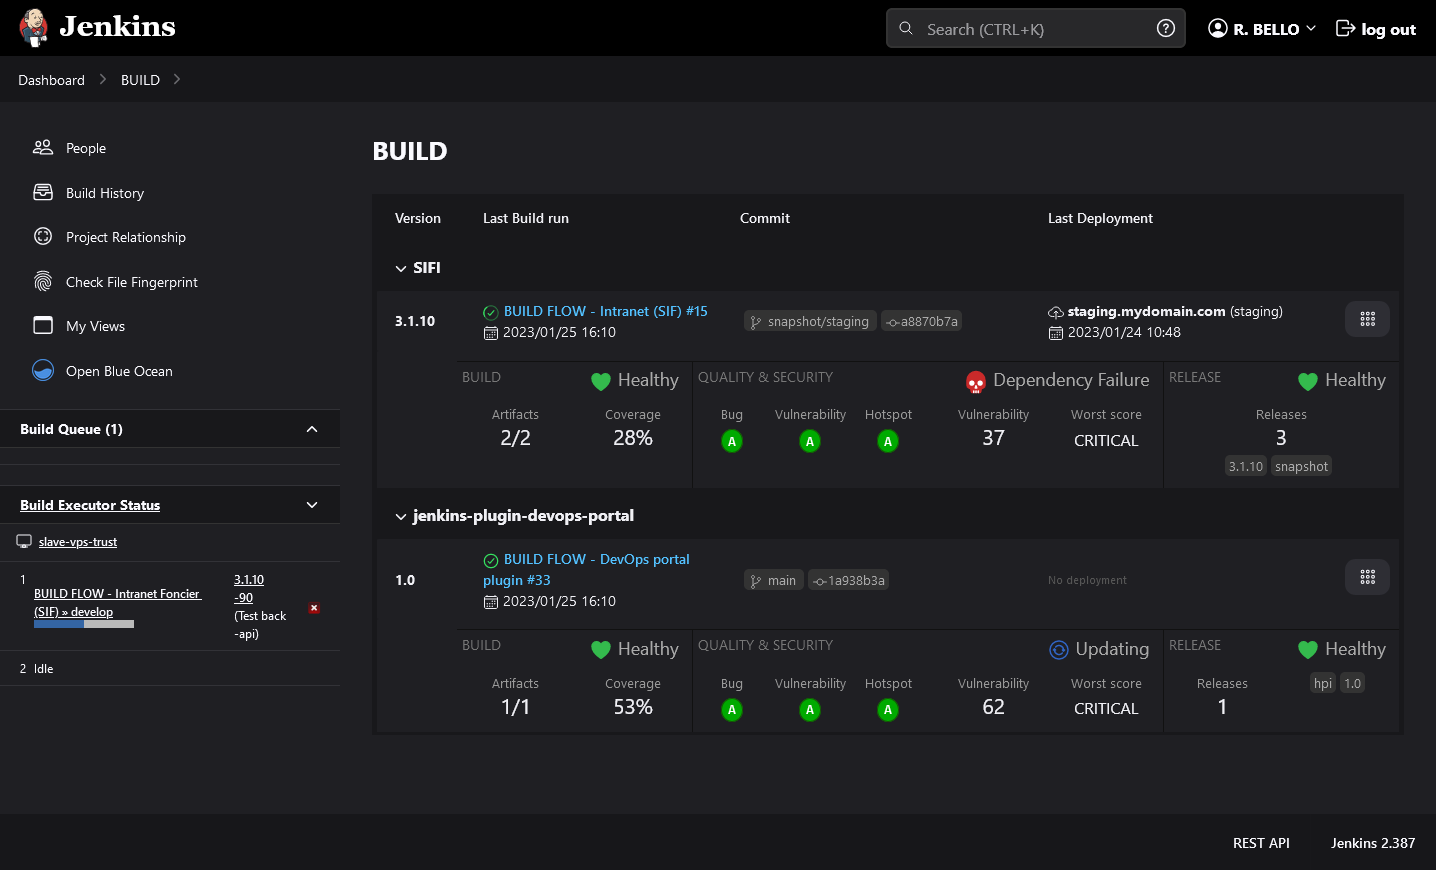
Bring together all the information about the build of your applications on a single dashboard:
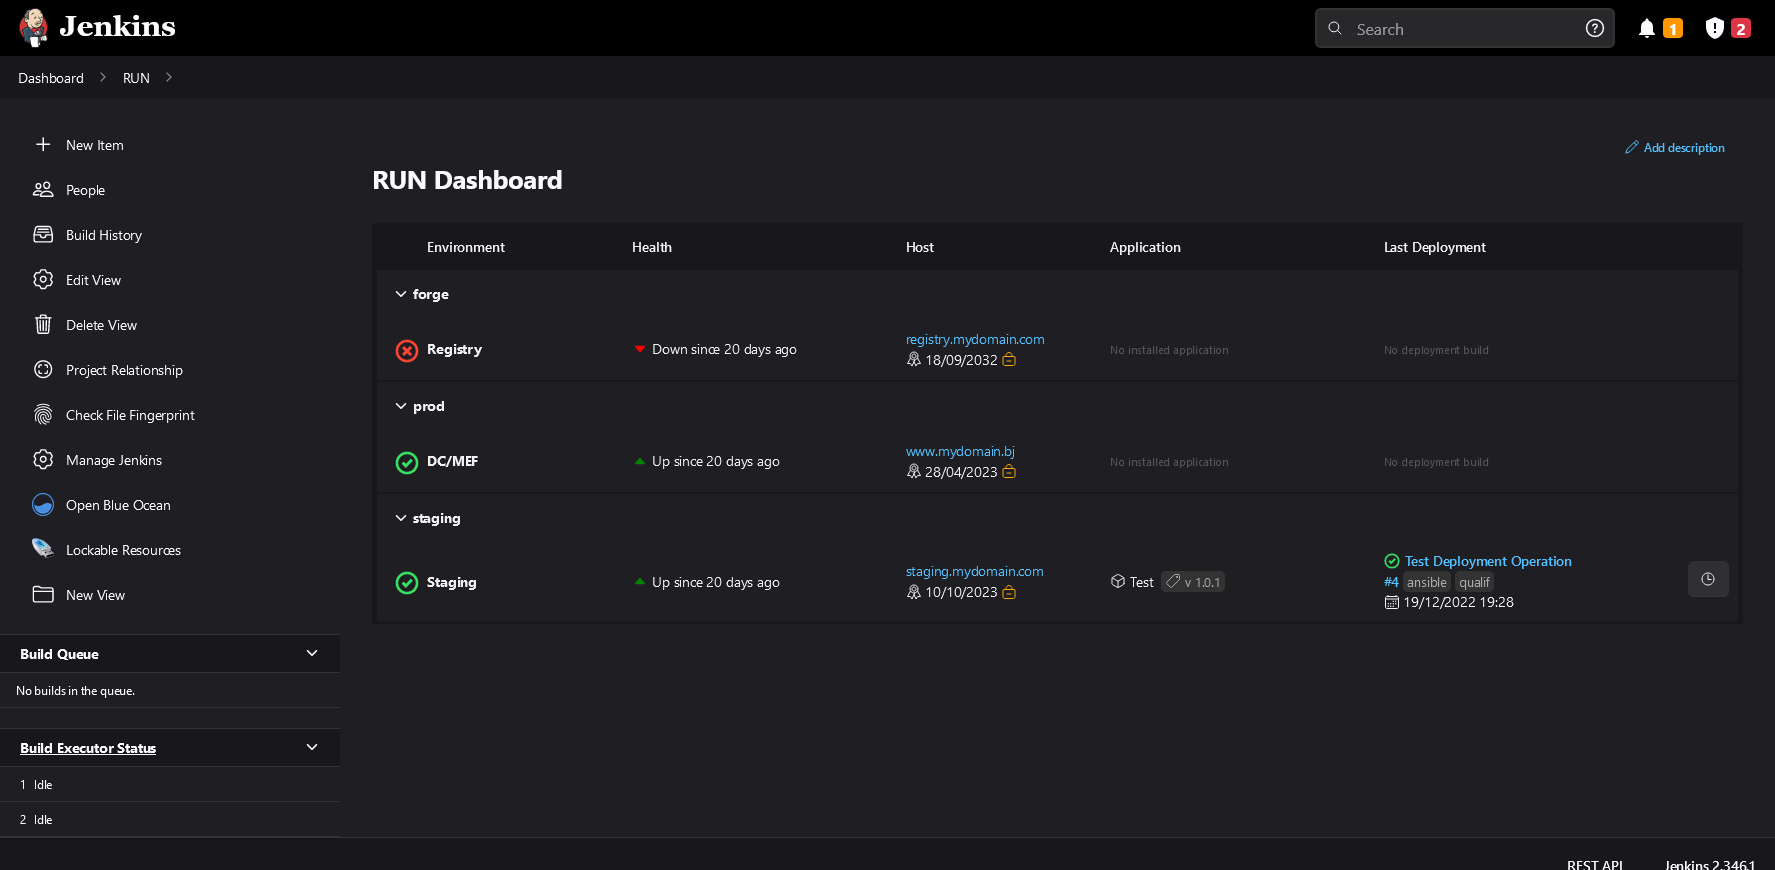
And allows you to check the deployment of your applications on your run environments and monitor the availability of services:
This plugin allows you to centralize in a Jenkins dashboard several functionalities necessary for a good DevOps approach. It works on the principle of a set of reporter tasks that are added to the build steps of your projects. The reporters gather the information and then display it in the dashboard.
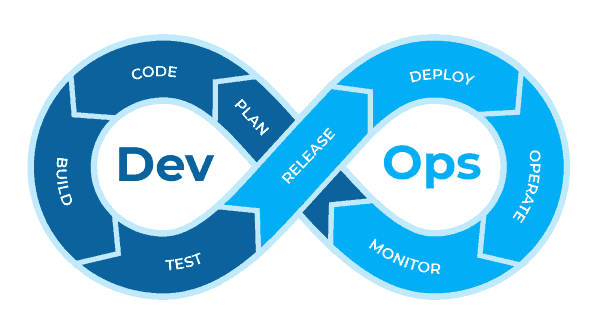
This allows you to obtain a synthetic view of all the steps to validate your software:
| Step | Feature |
|---|---|
| CODE | As the development progresses, the plugin offers a synthetic view to track the progress of the build of the different versions of your applications. |
| BUILD | It shows the status of each build and monitors that artifacts do not exceed a critical size. |
| TEST | It gathers results from unit tests and code quality audits into a single view (shows Sonar metrics in Jenkins) |
| RELEASE | It keeps track of releases made and that artifacts are properly published and tagged on repositories. |
| DEPLOY | It also keep track of all deployments performed on different environments directly into Jenkins. |
| OPERATE | Furthermore, it centralizes application performance testing (especially with JMeter) |
| MONITOR | Finally, a dashboard allows to monitor uptime for HTTP(S) services and certificate information. |
- Installing Prerequisites
- Manage 📦 BUILD activities
- Configure services environments
- Manage 🚀 RUN operations
- Pipeline Example
- Setup as developer
- Application architecture
- Supported translations: 🇫🇷 🇬🇧
- Install and enable plugin from
Jenkins Administration>Plugins>Available pluginsand search for "Devops Portal"
This plugin also allow to track many metrics of the software development.
Create new dashboard using: View > + button > View type: Build Dashboard
Example Dashboard :
The dashboard bring together much information:
- List all applications and versions
- Display last run with status
- If possible, display related VCS branch and commit (only GIT actually)
- Display the last deployment target environment
- Also, it can display a lot of activities:
- 🔹 Build artifacts: artifact file size
- 🔹 Unit testing: number of passed/failed/skipped tests, coverage and score
- 🔹 Code Quality & Security Audit: designed to gather SonarQube metrics into Jenkins, it displays the Quality Gate status, number of bugs/vulnerabilities/hotspot, code duplication and code volume. Hence, it also displays scores according to the quality gate.
- 🔹 Dependencies Analysis: number of outdated and vulnerable dependencies
- 🔹 Performance/load testing: score and Quality Gate status, number of load request and the average response time (in milliseconds)
- 🔹 Release: keep track of container images or artifacts built and published to a repository
Note: you can filter applications to display on the dashboard using Edit View. Regular expressions are supported.
Once the dashboard is created, you can feed it using an Activity Reporter.
You can report build activities using a special build step. In the Configure screen of a job, click on Add Build Step button and choose one among:
| Build step |
|---|
Record a build report |
Run with pipeline script (DSL):
reportBuild(
    applicationName: String,             // Name of application built
    applicationVersion: String,          // Version of application built
    applicationComponent: String,        // Name of application component built
    artifactFileName: String,            // Path to generated artifact
    artifactFileSizeLimit: int = 0       // Optional: put a limit on the artifact file size, causing the build to fail if exceeded
)
You can report build activities using a special build step. In the Configure screen of a job, click on Add Build Step button and choose one among:
| Build step |
|---|
Record a UT report manually |
Record a Surefire UT report |
Run with pipeline script (DSL):
reportUnitTest(
    applicationName: String,          // Name of application built
    applicationVersion: String,       // Version of application built
    applicationComponent: String,     // Name of application component built
    testCoverage: float = 0.0,        // Optional: coverage ratio (between 0-1)
    testsPassed: int,                 // Number of passed tests
    testsFailed: int,                 // Number of failed tests
    testsIgnored: int                 // Number of skipped tests
)
Required actions:
- Install plugin: Maven Integration and Pipeline Maven Integration
- Configure a Maven installation in Global Tools configuration page
Then you can record Surefire test reports using:
withMaven() {
    sh "mvn test"
}
reportSurefireTest(
    applicationName: String,       // Name of application built
    applicationVersion: String,    // Version of application built
    applicationComponent: String,  // Name of application component built
    surefireReportPath: String     // Path to the Surefire report file
)
You can report build activities using a special build step. In the Configure screen of a job, click on Add Build Step button and choose one among:
| Build step |
|---|
Record a quality audit manually |
Record a SonarQube quality audit |
Run with pipeline script (DSL):
reportQualityAudit(
    applicationName: String,                   // Name of application built
    applicationVersion: String,                // Version of application built
    applicationComponent: String,              // Name of application component built
    bugCount: int,                             // Number of bugs identified
    bugScore: String,                          // Choose amount: "A", "B", "C", "D", "E"
    vulnerabilityCount: int,                   // Number of vulnerabilities identified
    vulnerabilityScore: String,                // Choose amount: "A", "B", "C", "D", "E"
    hotspotCount: int,                         // Number of security hotspot identified
    hotspotScore: String,                      // Choose amount: "A", "B", "C", "D", "E"
    duplicationRate: float,                    // Number of bugs identified
    testCoverage: float,                       // Test coverage ratio (between 0-1)
    linesCount: long,                          // Number of source code lines
    qualityGatePassed: boolean                 // Indicate if the quality gate is reached
)
Required actions:
- Install plugin: Maven Integration and Pipeline Maven Integration
- Install plugin: SonarQube Scanner
- Configure a Maven installation in Global Tools configuration page
- Configure a SonarQube server in System Configuration page
- Configure a Secret text credential in Manage Credentials page
Then you can record SonarQube audit reports using:
withSonarQubeEnv(credentialsId: 'XXXXX', installationName: 'My SonarQube Server') {
    withMaven() {
        sh "mvn sonar:sonar"
    }
    reportSonarQubeAudit(
        applicationName: String,               // Name of application built
        applicationVersion: String,            // Version of application built
        applicationComponent: String,          // Name of application component built
        projectKey: String,                    // Project identifier on SonarQube server
        acceptInvalidCertificate: boolean      // Disable certificate verification (default: false)
    )
}
You can report build activities using a special build step. In the Configure screen of a job, click on Add Build Step button and choose one among:
| Build step |
|---|
Record a dependencies analysis |
Using MAVEN as dependencies manager, you need to add this plugin into your pom:
<plugins>
    <plugin>
        <groupId>org.owasp</groupId>
        <artifactId>dependency-check-maven</artifactId>
        <version>7.3.2</version>
        <executions>
            <execution>
                <goals>
                    <goal>check</goal>
                </goals>
            </execution>
        </executions>
        <configuration>
            <format>ALL</format>
            <outputDirectory>${project.basedir}/target</outputDirectory>
        </configuration>
    </plugin>
</plugins>
Then, when running your build add the dependency-check goal:
mvn -B -V -U -e -DskipTests clean package dependency-check:aggregate
Run with pipeline script (DSL):
reportMavenDependenciesAnalysis(
    applicationName: String,       // Name of application built
    applicationVersion: String,    // Version of application built
    applicationComponent: String,  // Name of application component built
    reportPath: String             // Path to the dependency analysis XML report
)
You can report build activities using a special build step. In the Configure screen of a job, click on Add Build Step button and choose one among:
| Build step |
|---|
Record a performance test |
Record a performance test with JMeter |
Run with pipeline script (DSL):
reportPerformanceTest(
    applicationName: String,       // Name of application built
    applicationVersion: String,    // Version of application built
    applicationComponent: String,  // Name of application component built
    testCount: int,                // Number of tests executed
    sampleCount: int,              // Number of samples (API calls) for all tests
    errorCount: int                // Number of error encountered
)
reportJMeterPerformanceTest(
    applicationName: String,       // Name of application built
    applicationVersion: String,    // Version of application built
    applicationComponent: String,  // Name of application component built
    jmeterReportPath: String       // Path to JMeter XML result file
)
You can report build activities using a special build step. In the Configure screen of a job, click on Add Build Step button and choose one among:
| Build step |
|---|
Record an artifact release |
Run with pipeline script (DSL):
reportRelease(
    applicationName: String,       // Name of application built
    applicationVersion: String,    // Version of application built
    applicationComponent: String,  // Name of application component built
    repositoryName: String,        // Registry server hostname
    artifactName: String,          // Image name released
    tags: String = null,           // Optional: comma-separated list of image's tags
                                   // Eg. "docker", "artifactory", "nexus", "ftp"
    artifactURL: String = null     // Optional: a link to the release
)
After the installation, a link allows to configure managed environments in Jenkins Administration:
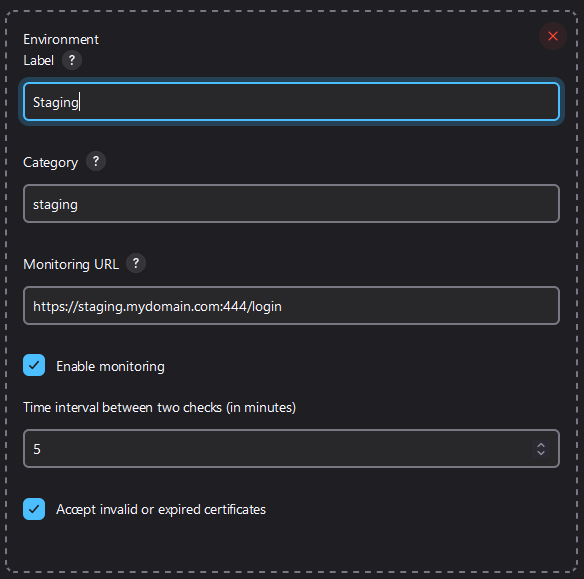
Then you can configure each environment to manage:
You have to provide:
- An unique label
- A category (like production, staging, ...)
- An optional monitoring URL
- A time interval (in minutes) between two monitoring checks
- A flag to accept invalid certificates (for monitoring URL)
Since you configured your environments, you can create a dashboard.
Create new dashboard using: View > + button > View type: Run Dashboard
Example dashboard :
The dashboard provides some information:
- Display all environments grouped by categories
- Display a status icon according to monitoring result:
- Show the certificate expiration date (if the given monitoring URL is HTTPS) and status:
- Display the last deployment information: application, version and jenkins run
- Also display the deployment tags, which allows to describe the deployment process (Eg.
ansible,ssh,ftp...)
Note: you can filter environment categories to display on the dashboard using Edit View. Regular expressions are supported.
Once the dashboard is created, you can feed it using an Operation Reporter.
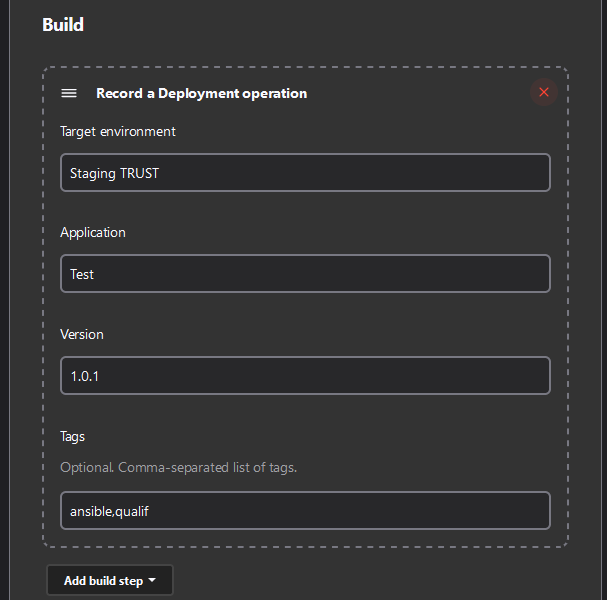
You can report Deployment operations, using a special build task. In the Configure screen of a job, click on Add Build Step button and choose Record a Deployment operation.
You have to fill in:
- The target environment name (declared previously in
Manage Environments) - The name of concerned application
- The version of concerned application
- Optionally, you can add tags to describe the operation (comma-separated)
The report can also be made using a Groovy Pipeline script using this command:
reportDeployOperation(
    targetService: String,        // Name for target environment to deploy to
    applicationName: String,      // Name of application deployed
    applicationVersion: String,   // Version of application deployed
    tags: String = null           // Optional: comma-separated list
)
| Sample | Content |
|---|---|
| Plugin build pipeline | Provides a complete example of integrating many BUILD activities |
- Checkout from: https://github.com/jenkinsci/devops-portal-plugin.git
- Recommended IDE is Intellij IDEA
- JDK 11 is preferred (newer JDK may introduce serialization issues)
- Run locally with:
mvn hpi:run -Djetty.port=5000 - Suggest any change by Forking the project and opening a Pull Request
flowchart TD

    subgraph Legend
        View:::view
        BuildStep:::reporter
        Persistent:::entity
        AsyncPeriodicWork:::worker
    end

    subgraph Configuration
        ManageEnvironment:::view --> ServiceConfiguration:::entity
    end

    subgraph BuildActivities[Build Activities]
        BuildActivityReporter:::reporter -.-> AbstractActivity:::entity
        UnitTestActivityReporter:::reporter -.-> AbstractActivity:::entity
        SurefireUnitTestActivityReporter:::reporter -.-> UnitTestActivityReporter:::reporter
        MavenDependenciesAnalysisActivityReporter:::reporter -.-> AbstractActivity:::entity
        PerformanceTestActivityReporter:::reporter -.-> AbstractActivity:::entity
        JMeterPerformanceTestActivity:::reporter -.-> PerformanceTestActivity:::reporter
        QualityAuditActivityReporter:::reporter -.-> AbstractActivity:::entity
        SonarQualityAuditReporter:::reporter -.-> QualityAuditActivityReporter:::reporter
        ArtifactReleaseActivityReporter:::reporter -.-> AbstractActivity:::entity
        AbstractActivity:::entity --o ApplicationBuildStatus:::entity
        SonarQualityAuditReporter:::reporter --> SonarQubeCheckPeriodicWork:::worker
        SonarQubeCheckPeriodicWork:::worker --> ApplicationBuildStatus:::entity
    end

    subgraph RunOperations[Run Operations]
        DeploymentOperationReporter:::reporter --> DeploymentOperation:::entity
    end

    subgraph RunMonitoring[Run Monitoring]
        MonitoringPeriodicWork:::worker --> ServiceMonitoring:::entity
    end

    Configuration --> RunOperations
    Configuration --> RunMonitoring
    RunOperations --> RunDashboard:::view
    RunMonitoring --> RunDashboard:::view
    BuildActivities --> BuildDashboard:::view
    RunOperations --> BuildDashboard:::view

    classDef view fill:#9e6d0b,color:#fff
    classDef reporter fill:#2f5894,color:#fff
    classDef entity fill:#247a20,color:#fff
    classDef worker fill:#8f2727,color:#fff
    linkStyle 3,4,5,6,7,8,9,10 stroke-width:2px,fill:none
To debug plugin behavior, configure a jenkins logger on the package: io.jenkins.plugins.devopsportal
This plugin is provided with 💗 by Rémi BELLO
Licence
GNU GENERAL PUBLIC LICENSE
Version 3, 29 June 2007


